Index
2.00
Опубликовано June 04, 2026
Dow Jones
Продать
SELL
Цена входа
51000.0000
Сведения о сигнале
Направление
Продать
Цена входа
51000.0000
Риск:Вознаграждение
1:1.25
Торговые уровни
Технический график
Анализ рынка
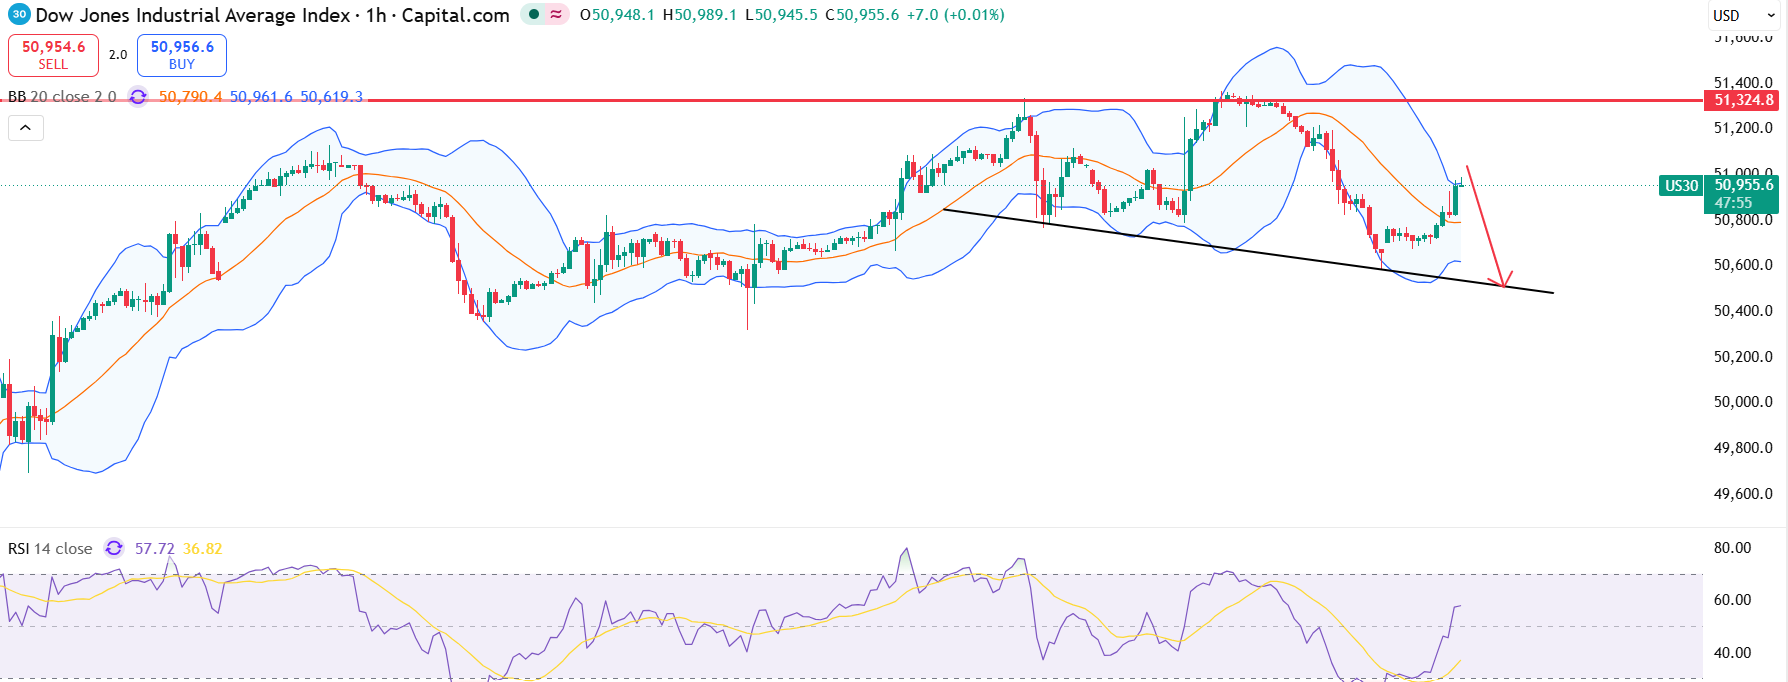
Dow futures rebounded from the previous session's losses. Technically, in the medium-term perspective, the current price action signals suggest that the bullish trend remains intact. However, in the short term, a significant resistance level persists at 51,000/100, a critical level that could affect near-term price movements. The price is approaching a key resistance zone again. Watch for a pullback.
Key Indicators
Despite the rebound, the 4-hour chart reveals weak upward momentum, showing signs of exhaustion on lower timeframes. Therefore, short‑term pullbacks are possible within broader consolidation.
Fundamental Context
The Dow Jones reached new record highs on Wednesday before giving up some gains, boosted by AI optimism and signs of cooling geopolitical tensions.
Предупреждение о риске
The overall structure is still bullish; any downside move looks like a pullback, not a trend change.
Другие анализы рынка
Изучайте больше профессиональных технических анализов на разных рынках и таймфреймах.
Gold
Купить
Цена входа
3970.0000
Сроки
3.00
Опубликовано June 30, 2026
EURJPY
Продать
Цена входа
185.2000
Сроки
2.00
Опубликовано June 30, 2026
EURAUD
Купить
Цена входа
1.6520
Сроки
2.00
Опубликовано June 29, 2026
USDJPY
Продать
Цена входа
162.0000
Сроки
5.00
Опубликовано June 25, 2026
Gold
Купить
Цена входа
3960.0000
Сроки
2.00
Опубликовано June 25, 2026
GBPUSD
Купить
Цена входа
1.3150
Сроки
2.00
Опубликовано June 25, 2026