Index
2.00
Опубликовано July 15, 2026
Dow Jones
Купить
BUY
Цена входа
52400.0000
Сведения о сигнале
Направление
Купить
Цена входа
52400.0000
Риск:Вознаграждение
1:1
Торговые уровни
Технический график
Анализ рынка
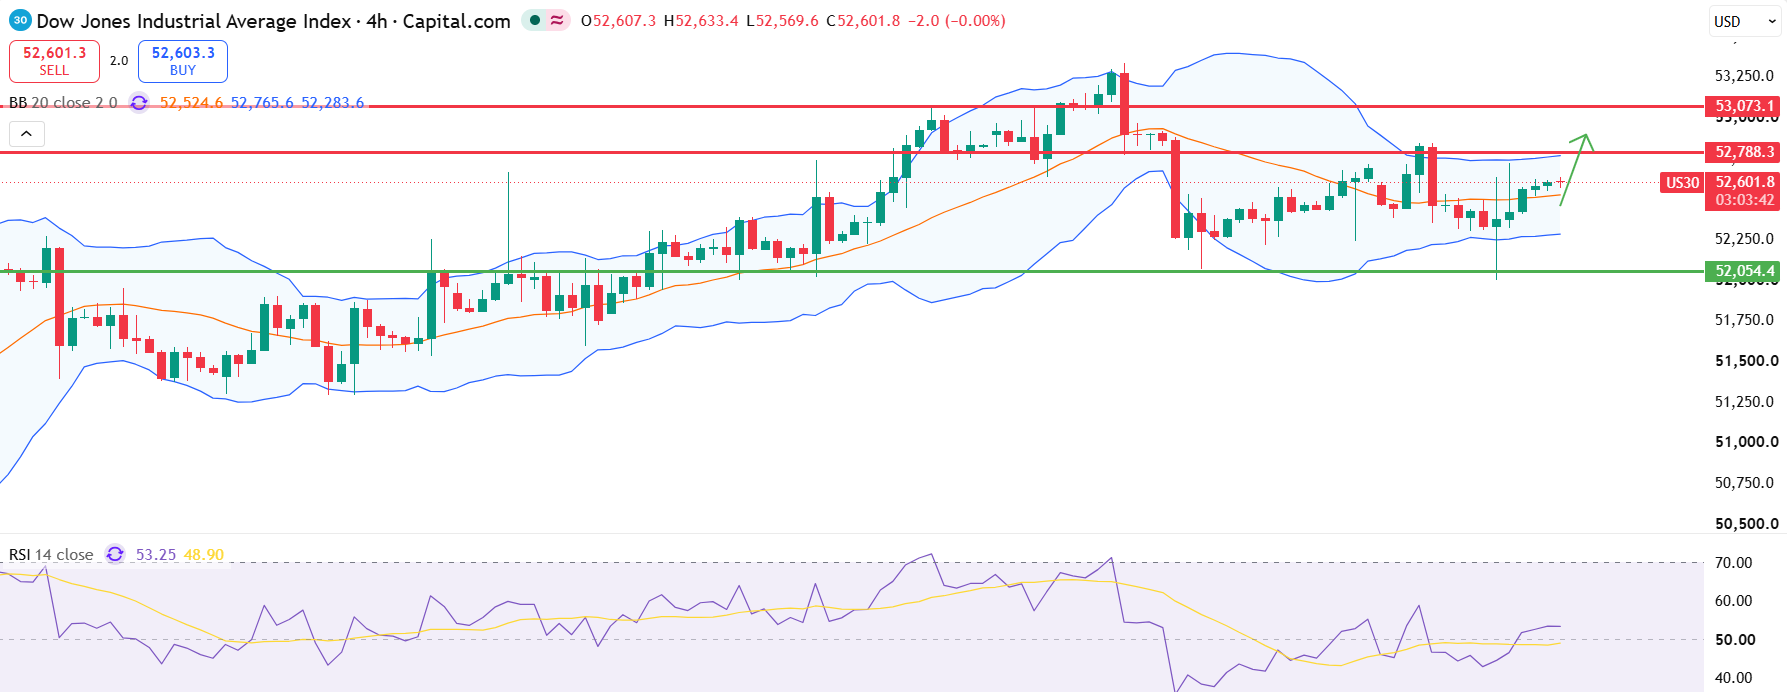
Dow Jones rebounded sharply from the early losses as softer-than-expected inflation data reduced expectations of a near-term Federal Reserve interest rate hike. The technical outlook on the daily chart continues to indicate a bullish trend, supported by a robust rebound.
Key Indicators
Dow formed a short-term base near 52k after correction. Bulls are defending the 52,000 support to prevent increased bearish pressure and potentially stronger sell-offs.
Fundamental Context
Wall Street closed higher across all three major indexes, as markets reacted positively to the soft CPI data. Today, traders and investors should closely monitor the release of the latest US PPI data, along with comments from several Fed officials, for clues about the size of futures rate cuts by the US Federal Reserve.
Предупреждение о риске
The Dow recovered after the pullback. Technically, the immediate outlook is slightly neutral to bullish now, as it seems the bulls are not ready to push the index lower.
Другие анализы рынка
Изучайте больше профессиональных технических анализов на разных рынках и таймфреймах.
Gold
Купить
Цена входа
4015.0000
Сроки
1.00
Опубликовано July 29, 2026
Dollar Index
Купить
Цена входа
101.4500
Сроки
2.00
Опубликовано July 28, 2026
EURUSD
Продать
Цена входа
1.1375
Сроки
2.00
Опубликовано July 28, 2026
Bitcoin
Продать
Цена входа
63700.0000
Сроки
2.00
Опубликовано July 28, 2026
Gold
Купить
Цена входа
4030.0000
Сроки
3.00
Опубликовано July 24, 2026
GBPUSD
Купить
Цена входа
1.3305
Сроки
3.00
Опубликовано July 24, 2026