Forex
2.00
Опубликовано April 30, 2026
USDJPY
Продать
SELL
Цена входа
160.7000
Сведения о сигнале
Направление
Продать
Цена входа
160.7000
Риск:Вознаграждение
1:1.5
Торговые уровни
Технический график
Анализ рынка
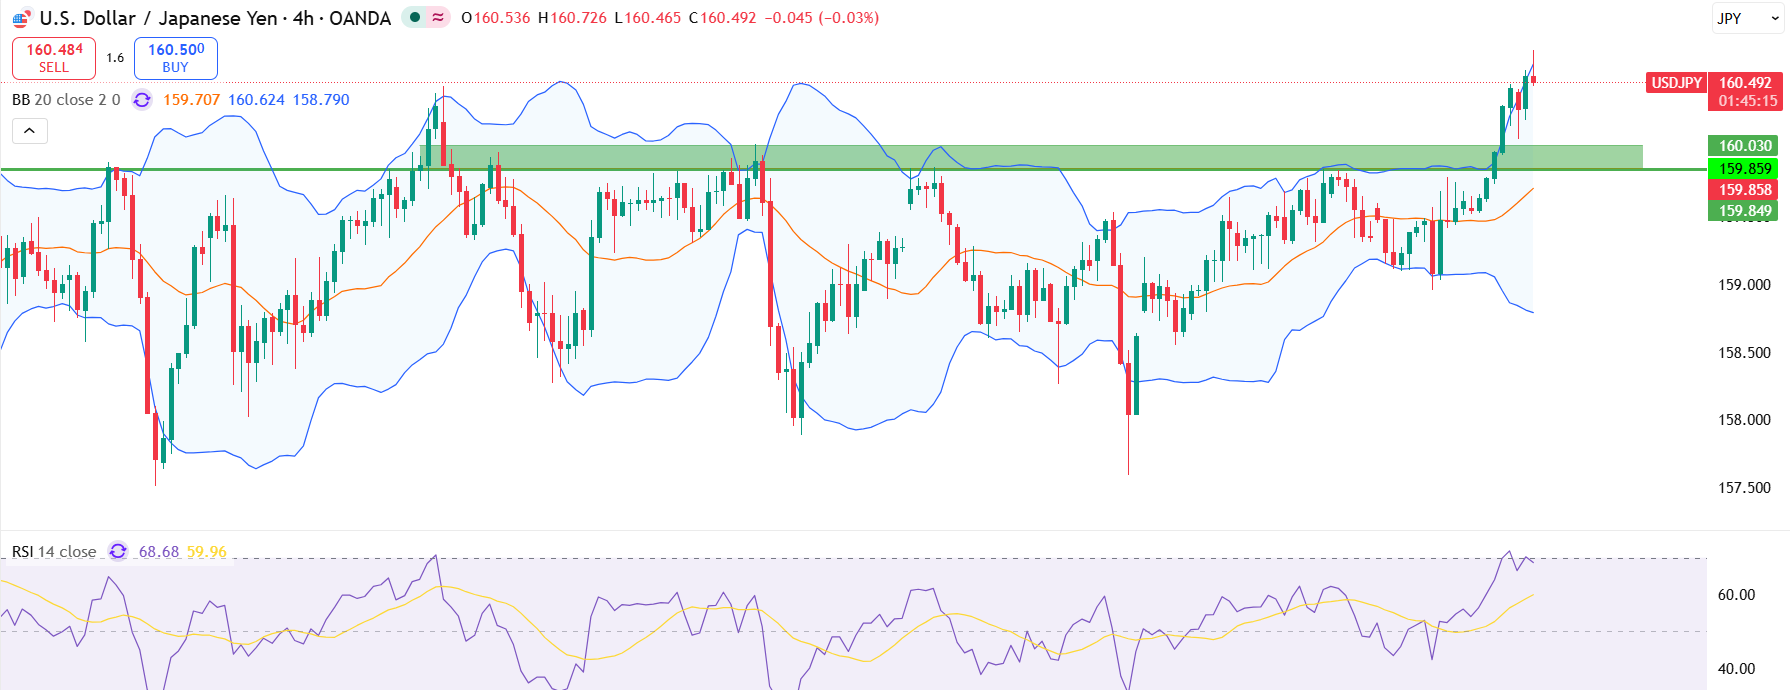
USD/JPY climbed to a fresh multi-month high of 160.70. However, we may expect some profit-taking and certain manipulation around the current highs, with the price likely to test the immediate support zone 160/159.85 (prior resistance) before any sustainable new leg up.
Key Indicators
GBPJPY faces short-term rejection near the daily high of 160.70 due to a lack of price movement.
The 4-hour chart reveals weak upward momentum, showing signs of exhaustion on lower timeframes.
Fundamental Context
USD/JPY soared to a new 21-month high after breaking through the 160 barrier. The strong US dollar and geopolitical concerns are the primary drivers of the upward trend.
Предупреждение о риске
The overall structure is still bullish; any downside move looks like a pullback, not a trend change. The overall momentum remains bullish.
Другие анализы рынка
Изучайте больше профессиональных технических анализов на разных рынках и таймфреймах.
Gold
Продать
Цена входа
4125.0000
Сроки
2.00
Опубликовано June 23, 2026
AUDNZD
Продать
Цена входа
1.2230
Сроки
2.00
Опубликовано June 23, 2026
EURJPY
Продать
Цена входа
184.4000
Сроки
2.00
Опубликовано June 23, 2026
USDCAD
Продать
Цена входа
1.4190
Сроки
2.00
Опубликовано June 22, 2026
EURCAD
Продать
Цена входа
1.6260
Сроки
2.00
Опубликовано June 18, 2026
AUDNZD
Продать
Цена входа
1.2165
Сроки
2.00
Опубликовано June 18, 2026