Index
3.00
Δημοσιεύτηκε June 24, 2026
Dollar Index
Πώληση
SELL
Τιμή Εισόδου
101.5500
Λεπτομέρειες σήματος
Κατεύθυνση
Πώληση
Τιμή Εισόδου
101.5500
Κίνδυνος:Ανταμοιβή
1:1
Επίπεδα Συναλλαγών
Τεχνικό Διάγραμμα
Ανάλυση Αγοράς
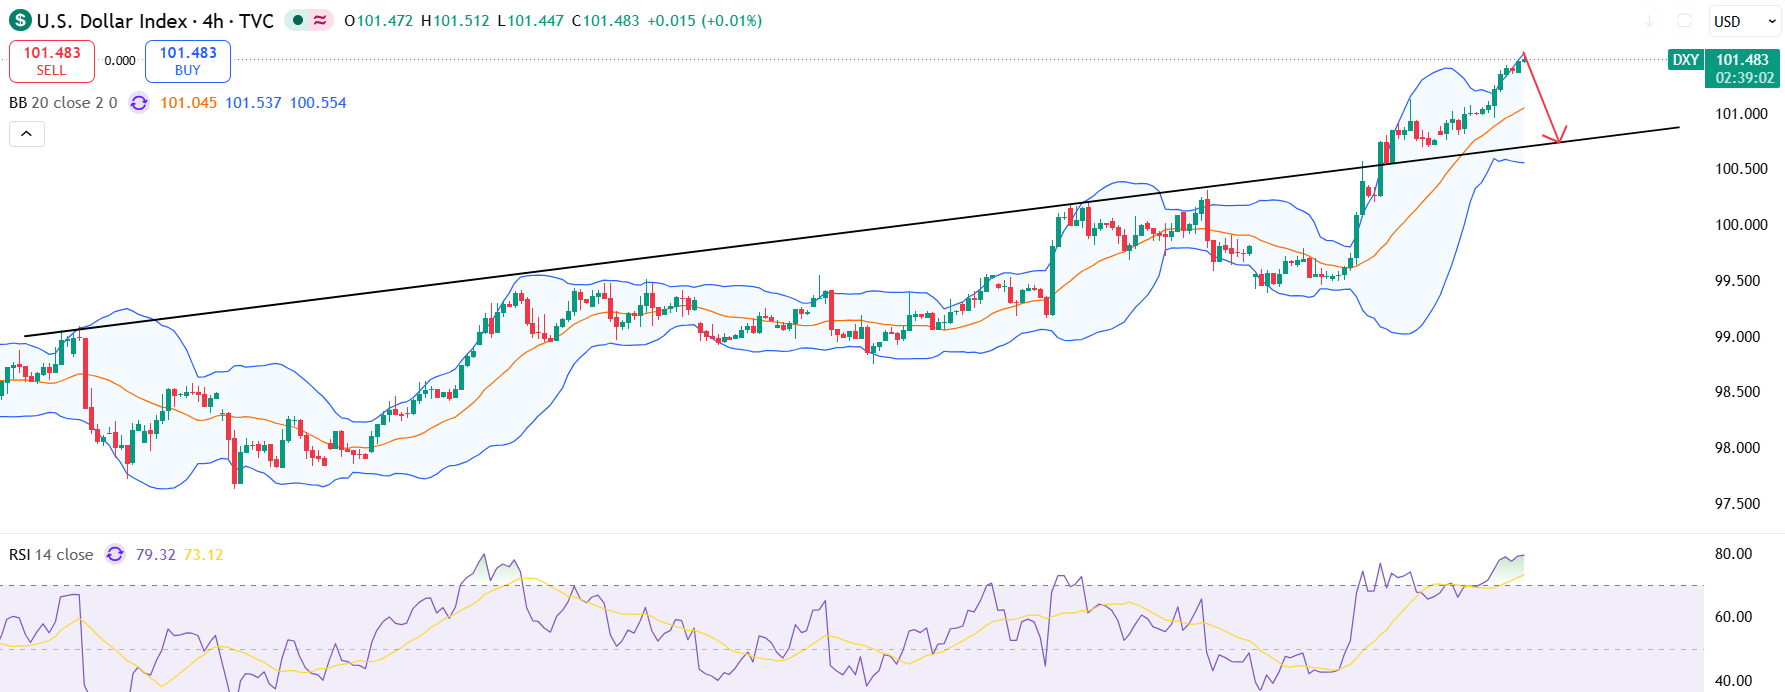
The dollar index (DXY) climbed to its highest level in more than a year as expectations for Federal Reserve rate hikes this year remained strong. However, we may expect some profit-taking and certain manipulation around the current highs.
Key Indicators
DXY bulls maintained control with a powerful bullish continuation candle, but the price is approaching a key red horizontal resistance zone of 101.60.
Fundamental Context
The market's next focus will be the upcoming US PCE inflation report, which could determine whether the current upward pressure on the DXY will continue.
Ειδοποίηση Κινδύνου
The DXY may face short-term rejection near 101.60. However, the consolidation near current highs suggests accumulation before the next expansion move.
Άλλες Αναλύσεις Αγοράς
Εξερευνήστε περισσότερες επαγγελματικές τεχνικές αναλύσεις σε διαφορετικές αγορές και χρονικά πλαίσια.