Λεπτομέρειες σήματος
Επίπεδα Συναλλαγών
Τεχνικό Διάγραμμα
Ανάλυση Αγοράς
Key Indicators
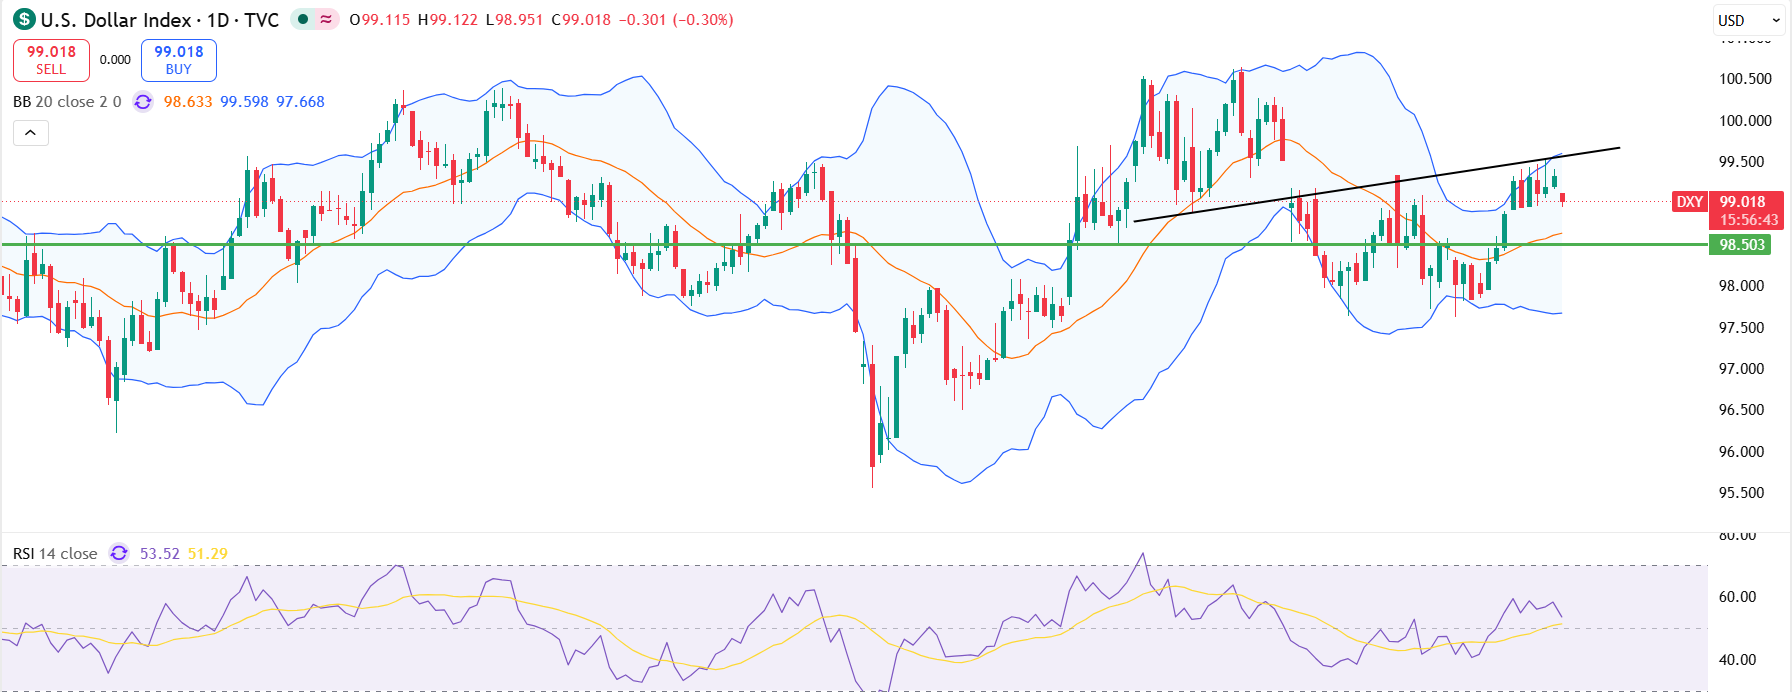
The 99.60/70 range is a brick wall—crucial resistance has frequently halted advances here.
The daily chart reveals weak upward momentum; the price is struggling near resistance.
Fundamental Context
The price behaviour of the US Dollar Index, which measures the value of the US dollar against a basket of six major currencies, is trading sideways following a powerful rebound. Fundamentally, if US-Iran tensions continue to decrease and oil prices remain constant, a healthy pullback would be quite beneficial here.
Ειδοποίηση Κινδύνου

At FX Junction, Syam turns complex market information into clear and useful insights. His work combines technical and fundamental analysis, portfolio management, risk management and timely commentary on global developments. Whether markets are calm or moving fast, Syam focuses on what matters most: understanding the bigger picture, spotting meaningful opportunities and keeping risk firmly in view.