Forex
2.00
Опубликовано August 31, 2026
EURUSD
Продать
SELL
Цена входа
1.1600
Сведения о сигнале
Направление
Продать
Цена входа
1.1600
Риск:Вознаграждение
1;1
Торговые уровни
Технический график
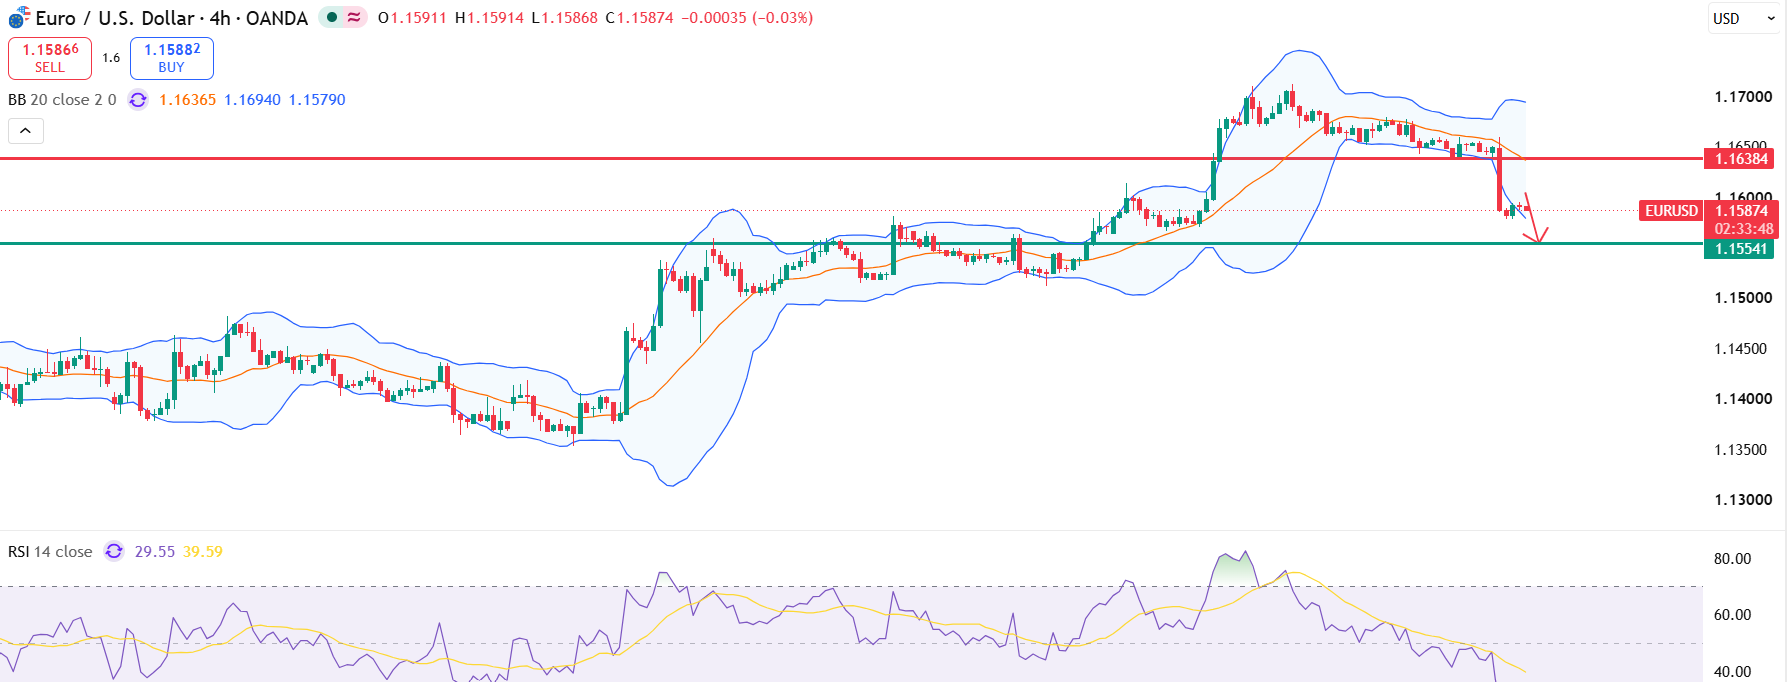
Анализ рынка
The EUR/USD is currently trading at 1.1588 on the daily chart. The 200-day moving average serves as a critical make-or-break level for both bulls and bears, presenting significant resistance for the pair. The currency pair is approaching a no-man's-land, where substantial price swings could occur due to diminishing bullish momentum and the price being caught between two major trend lines.
Key Indicators
A recent shift—MACD turning bearish and price forming lower highs—signals the rally is tired. Meanwhile, declining volume on the most recent dip hints that neither side is fully in control.
Fundamental Context
The currency pair slightly rebounded from the Friday losses. As of this writing, the pair trades at 1.1590. Short-term price action shows a rebound from local lows, but upside momentum seems limited. Going ahead, a decisive breakout on either side of the current range is likely to determine the next directional move in the pair.
Предупреждение о риске
Sell rallies while the price remains below 1.1650, but avoid chasing weakness into Friday’s payroll release.
Другие анализы рынка
Изучайте больше профессиональных технических анализов на разных рынках и таймфреймах.
GBPUSD
Продать
Цена входа
1.3515
Сроки
2.00
Опубликовано September 02, 2026
GBPNZD
Продать
Цена входа
2.3160
Сроки
3.00
Опубликовано September 02, 2026
Gold
Купить
Цена входа
4285.0000
Сроки
3.00
Опубликовано September 02, 2026
EURGBP
Продать
Цена входа
0.8572
Сроки
3.00
Опубликовано September 01, 2026
AUDUSD
Продать
Цена входа
0.7160
Сроки
3.00
Опубликовано September 01, 2026
Silver
Купить
Цена входа
68.3000
Сроки
3.00
Опубликовано August 26, 2026