Sinyal Ayrıntıları
Ticaret Seviyeleri
Teknik Grafik
Pazar Analizi
Key Indicators
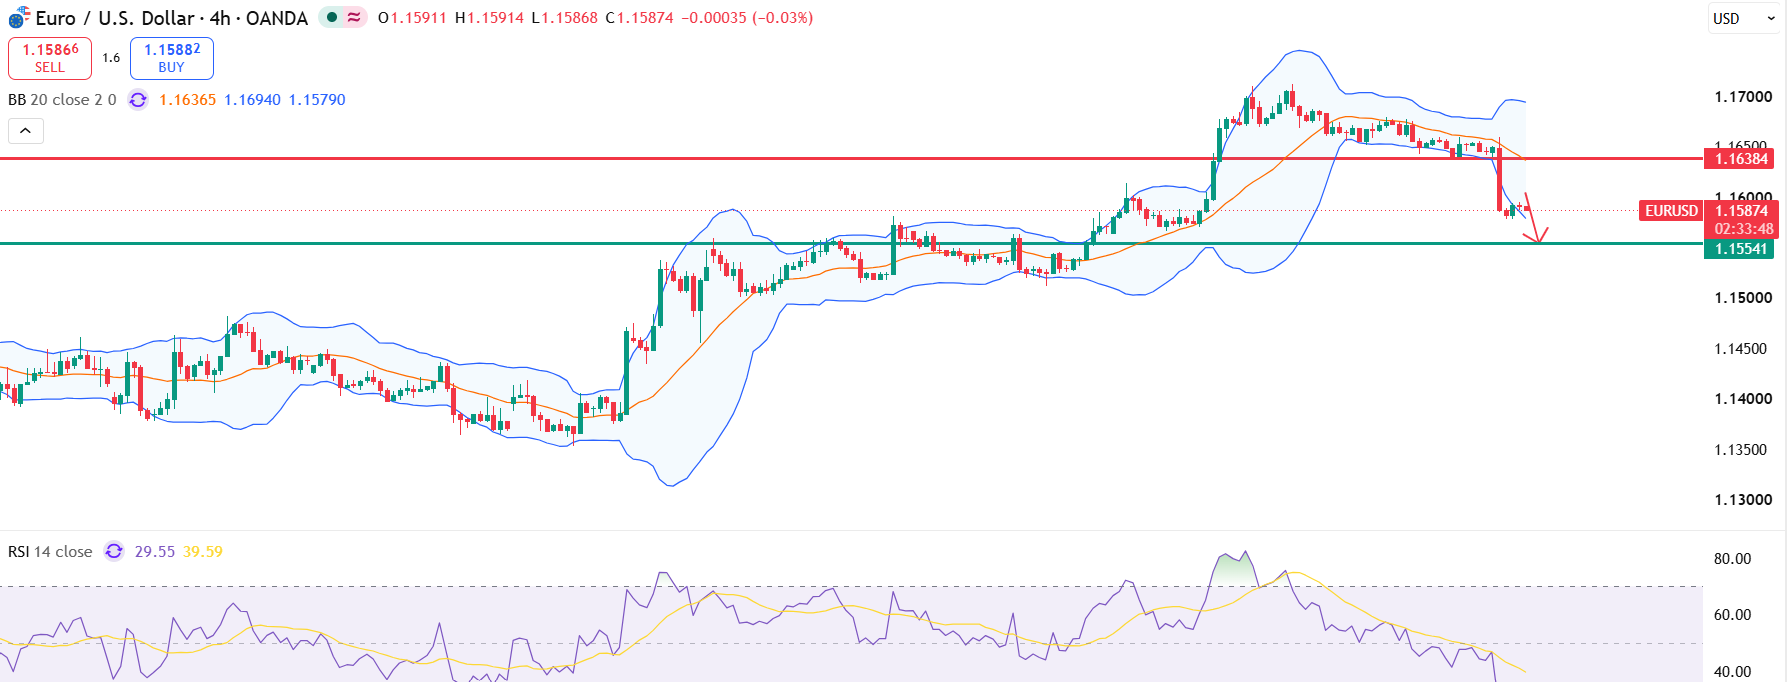
A recent shift—MACD turning bearish and price forming lower highs—signals the rally is tired. Meanwhile, declining volume on the most recent dip hints that neither side is fully in control.
Fundamental Context
The currency pair slightly rebounded from the Friday losses. As of this writing, the pair trades at 1.1590. Short-term price action shows a rebound from local lows, but upside momentum seems limited. Going ahead, a decisive breakout on either side of the current range is likely to determine the next directional move in the pair.
Risk Uyarısı

At FX Junction, Syam turns complex market information into clear and useful insights. His work combines technical and fundamental analysis, portfolio management, risk management and timely commentary on global developments. Whether markets are calm or moving fast, Syam focuses on what matters most: understanding the bigger picture, spotting meaningful opportunities and keeping risk firmly in view.