Dollar appears to be undergoing a correction phase
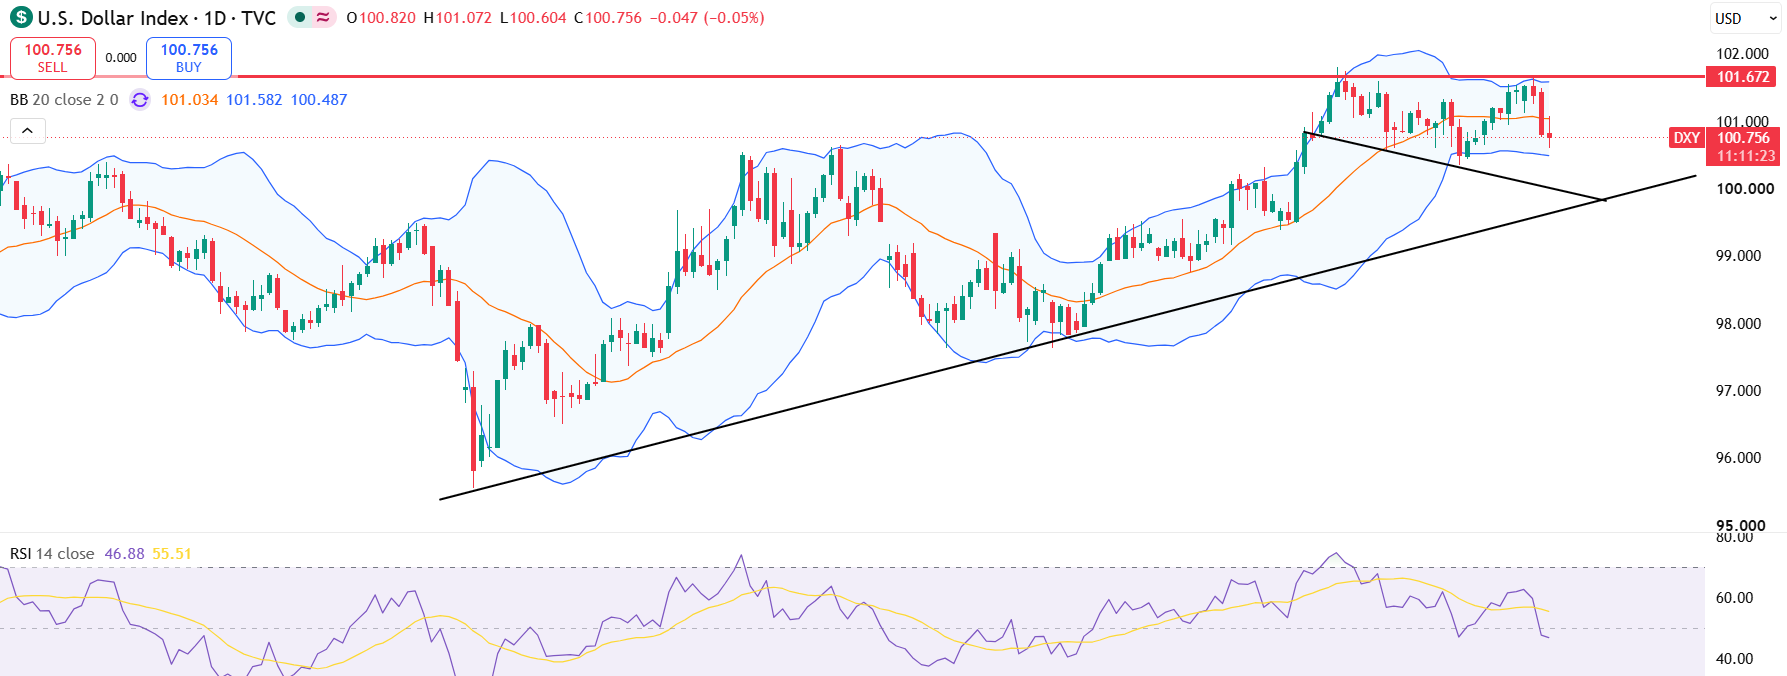
Following the Federal Open Market Committee (FOMC) meeting, the US dollar declined broadly. From a technical perspective, the Dollar Index daily chart displays a double-top pattern near the 101.80 level.
Following the Federal Open Market Committee (FOMC) announcement on Wednesday, the dollar declined broadly. The Federal Reserve maintained interest rates between 3.5% and 3.75%, despite inflation remaining above target levels and renewed energy price shocks. Notably, three FOMC members dissented, advocating for a 25 basis point rate increase.
Get ready for another volatile New York trading session
As investors prepare for a potentially volatile New York trading session, all attention is focused on the economic calendar for key events that could shape market sentiment and influence investment decisions. Key releases include the June core Personal Consumption Expenditures (PCE) inflation data and the US Q2 GDP figures. These reports hold the potential to significantly impact USD currency pairs and overall market dynamics. The US economy is forecasted to have grown at an annualized rate of 2.1% in Q2, consistent with the pace recorded in Q1. These data points will be crucial in evaluating the likelihood of a rate hike in December. Following the recent Federal Open Market Committee (FOMC) meeting, market expectations for a September rate increase have declined to 64% from 81%.
Dollar Index (DXY) Technical Outlook
From a technical perspective, the Dollar Index daily chart displays a double-top pattern near the 101.80 level. A closer analysis is required to ascertain if this represents a longer-term peak or if new highs are attainable, as the failure to surpass this resistance has triggered some profit-taking. The next two daily candlesticks will provide important technical signals regarding the potential confirmation of the double top. For the index to advance further, a breakout above the 101.80 resistance is necessary. On the downside, critical support lies at the 100.00 level; a daily close below this threshold would indicate a significant bearish shift.
Warning! This material is not intended as investment advice. Past performance data does not guarantee future returns. Investing in foreign currencies may affect your returns due to their fluctuations. Any transaction in securities may result in both profits and losses. The assumptions and expectations set forth in this material are only estimates that may not be accurate and may change depending on current economic conditions. These statements do not guarantee future returns.

Meet Syam KP, a financial markets professional with more than fourteen years of experience in forex, CFDs and capital markets. Since 2012, he has worked with several brokerage firms as a trader and market strategist, developing a practical understanding of how markets move. He also holds a qualification from CISI in the United Kingdom.
At FX Junction, Syam turns complex market information into clear and useful insights. His work combines technical and fundamental analysis, portfolio management, risk management and timely commentary on global developments. Whether markets are calm or moving fast, Syam focuses on what matters most: understanding the bigger picture, spotting meaningful opportunities and keeping risk firmly in view.
Relaterte artikler
Gold Rebounds as KOSPI Selloff Triggers Halt
Gold recovers as Asian stocks fall and South Korea’s KOSPI triggers a 20-minute trading halt. The immediate question is whether a softer dollar can sustain the rebound while inflation keeps interest-rate risks in focus.
Les mer →ASML Posts Record Sales and Lifts Its Outlook
ASML reports record sales and a stronger outlook as customers expand their AI investment plans. The immediate question is whether the company can turn rising equipment demand into sustained earnings growth while increasing production capacity.
Les mer →