Forex
3.00
Опубликовано April 15, 2026
Dollar Index
Продать
SELL
Цена входа
98.2500
Сведения о сигнале
Направление
Продать
Цена входа
98.2500
Риск:Вознаграждение
1:1.3
Торговые уровни
Технический график
Анализ рынка
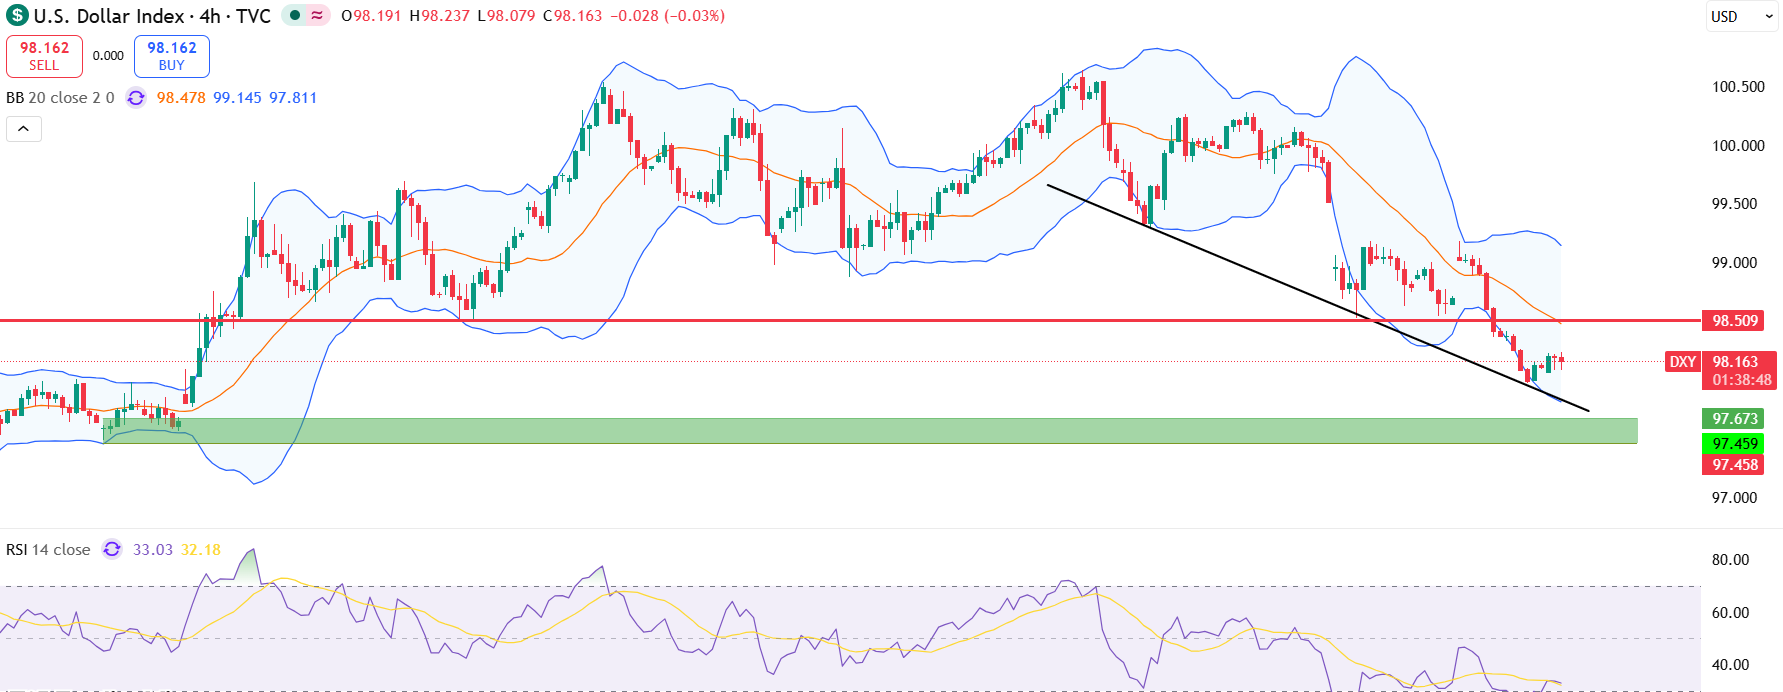
The US dollar Index (DXY) is experiencing a modest recovery on Wednesday morning. However, the current rebound still looks driven more by short covering than by a clearly strong wave of spot buying.
Key Indicators
Key Indicators
The rebound is marked by limited volume, suggesting a lack of strong conviction so far.
The damage to the structure is evident, with weakening short-term moving averages and neutral-to-bearish oscillator readings signaling potential further declines.
Fundamental Context
The price action of the US Dollar Index, which measures the greenback’s value against the basket of six major currencies trading sideways after the sharp fall. Fundamentally, if US-Iran tensions continue to ease and oil prices remain stable, this relief rally could lose momentum.
Предупреждение о риске
The dollar is attempting to recover, but it confronts more than just resistance. Fed rate policy uncertainty and continued geopolitical tensions are driving short-term positioning.
Другие анализы рынка
Изучайте больше профессиональных технических анализов на разных рынках и таймфреймах.
GBPUSD
Купить
Цена входа
1.3410
Сроки
3.00
Опубликовано July 21, 2026
Gold
Купить
Цена входа
4045.0000
Сроки
2.00
Опубликовано July 21, 2026
Dollar Index
Продать
Цена входа
101.0000
Сроки
3.00
Опубликовано July 21, 2026
EURGBP
Купить
Цена входа
0.8485
Сроки
2.00
Опубликовано July 20, 2026
GBPUSD
Купить
Цена входа
1.3425
Сроки
2.00
Опубликовано July 17, 2026
EURUSD
Купить
Цена входа
1.1455
Сроки
2.00
Опубликовано July 16, 2026