Index
2.00
Опубликовано July 23, 2026
Dow Jones
Продать
SELL
Цена входа
52400.0000
Сведения о сигнале
Направление
Продать
Цена входа
52400.0000
Риск:Вознаграждение
1:1.5
Торговые уровни
Технический график
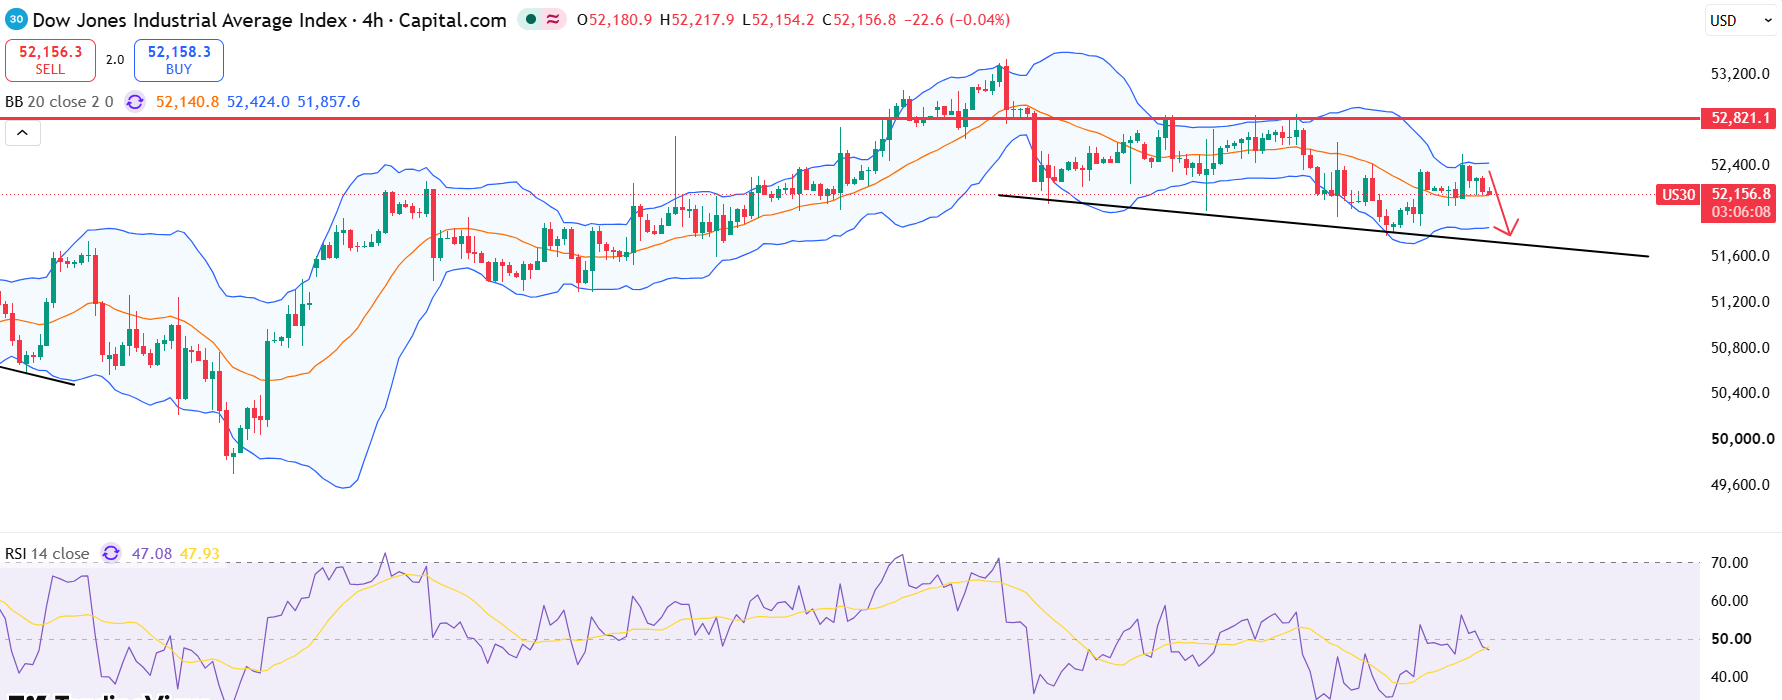
Анализ рынка
Dow Jones recently found support around the 51,800 area and rebounded, but upward momentum remains limited as it faces resistance near 52,600.
Key Indicators
Despite the rebound, the 4-hour chart reveals weak upward momentum, showing signs of exhaustion on lower timeframes.
The price stays below the 20-day SMA, and RSI is struggling to hold above 50, suggesting weak buying momentum.
Fundamental Context
Despite the rebound, the US30 is still struggling to regain strong momentum, as the short-term trend remains neutral to bearish. Therefore, further pullbacks are possible within broader consolidation.
Предупреждение о риске
Short-term price action shows a rebound from local lows, but upside momentum seems limited.
Другие анализы рынка
Изучайте больше профессиональных технических анализов на разных рынках и таймфреймах.
GBPUSD
Купить
Цена входа
1.3535
Сроки
2.00
Опубликовано September 09, 2026
NZDUSD
Купить
Цена входа
0.5845
Сроки
2.00
Опубликовано September 09, 2026
Gold
Купить
Цена входа
4365.0000
Сроки
2.00
Опубликовано September 09, 2026
EURJPY
Купить
Цена входа
178.6500
Сроки
2.00
Опубликовано September 08, 2026
Dow Jones
Продать
Цена входа
53050.0000
Сроки
3.00
Опубликовано September 08, 2026
Dollar Index
Купить
Цена входа
98.7500
Сроки
3.00
Опубликовано September 08, 2026