Index
3.00
Опубликовано August 12, 2026
Dow Jones
Продать
SELL
Цена входа
54000.0000
Сведения о сигнале
Направление
Продать
Цена входа
54000.0000
Риск:Вознаграждение
1:1
Торговые уровни
Технический график
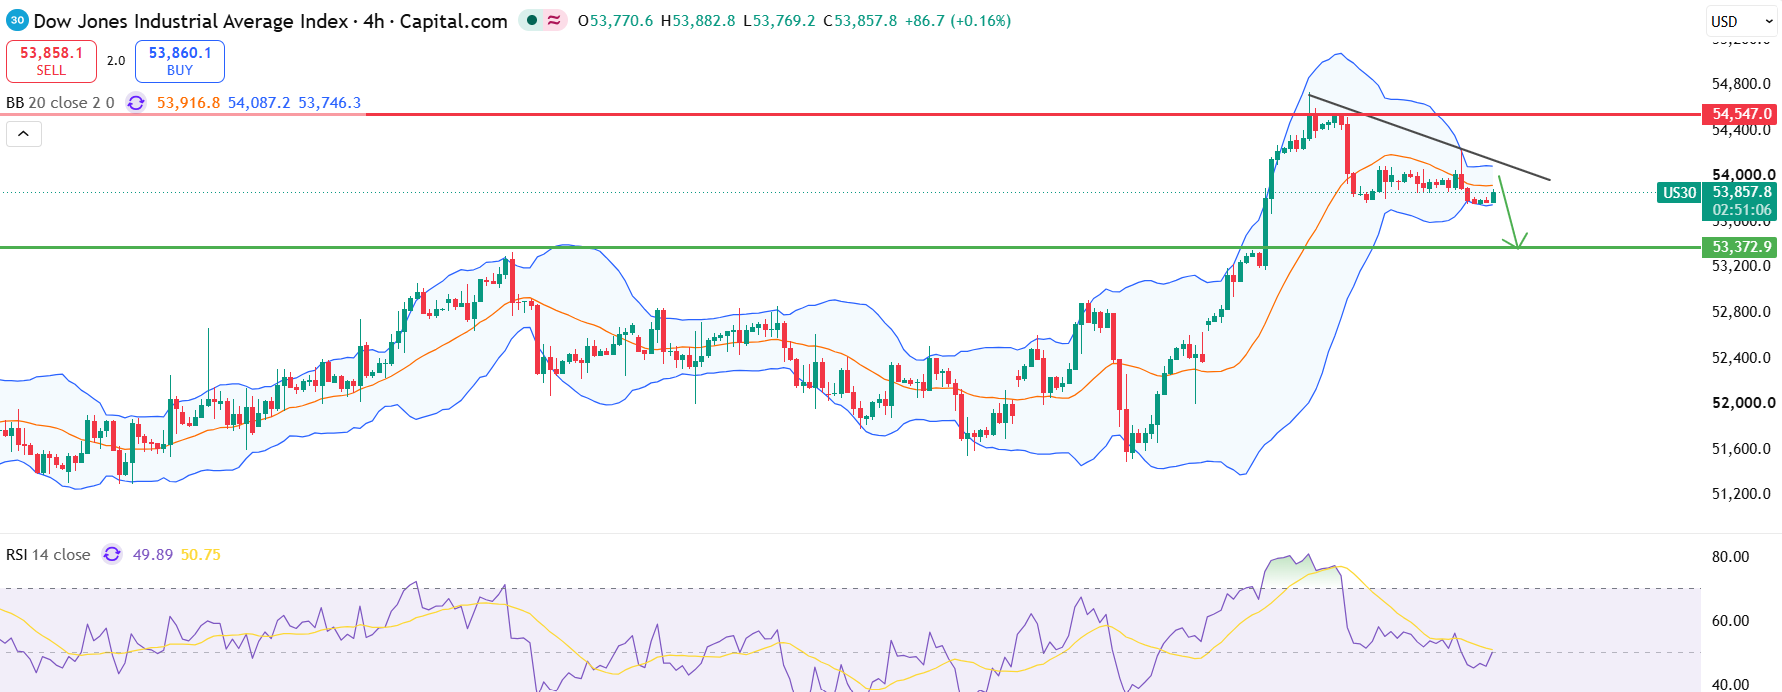
Анализ рынка
The Dow Jones posted a sharp pullback after a failed push above its all-time high, forming a bearish engulfing candle.
Key Indicators
The bullish momentum is fading. RSI is diverging bearishly, and volume is declining as the index pulls back—a sign of profit-taking.
Fundamental Context
Dow futures slightly rebounded from the previous session's losses. However, the index is still struggling to regain strong momentum, as the short-term trend remains neutral to bearish. Therefore, further pullbacks are possible within broader consolidation.
Предупреждение о риске
The 4-hour chart reveals weak upward momentum; the price is struggling to extend momentum.
Другие анализы рынка
Изучайте больше профессиональных технических анализов на разных рынках и таймфреймах.
USDCAD
Купить
Цена входа
1.3920
Сроки
2.00
Опубликовано August 12, 2026
EURUSD
Продать
Цена входа
1.1550
Сроки
2.00
Опубликовано August 12, 2026
GBPUSD
Продать
Цена входа
1.3510
Сроки
2.00
Опубликовано August 11, 2026
EURAUD
Продать
Цена входа
1.6395
Сроки
3.00
Опубликовано August 11, 2026
Gold
Купить
Цена входа
4358.0000
Сроки
2.00
Опубликовано August 11, 2026
AUDNZD
Продать
Цена входа
1.2000
Сроки
2.00
Опубликовано August 06, 2026