Forex
2.00
Опубликовано July 16, 2026
USDJPY
Продать
SELL
Цена входа
162.2000
Сведения о сигнале
Направление
Продать
Цена входа
162.2000
Риск:Вознаграждение
1:1.5
Торговые уровни
Технический график
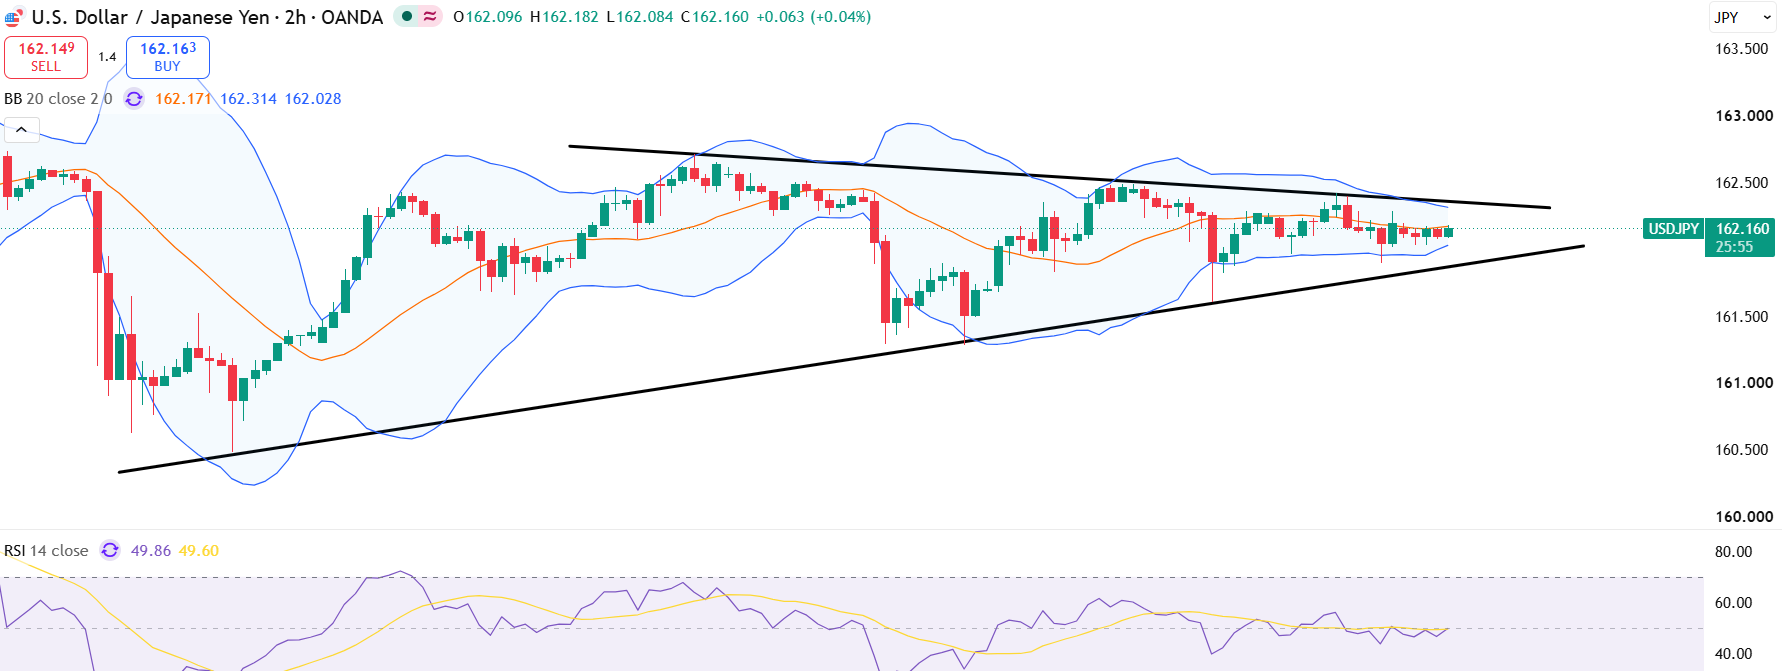
Анализ рынка
USD/JPY hovers above the 162.00 psychological zone, where a descending triangle base, Fibonacci 50% retracement, and Ichimoku cloud bottom all collide—if this floor breaks, bears have room toward 161.30–160.80Key Indicators
Key Indicators
Technically, the overall momentum remains bullish. Nevertheless, a healthy pullback and consolidation are anticipated as the pair struggles to extend the upside momentum.
Fundamental Context
For the rest of the week, the main drivers of USDJPY remain the US dollar's movement, Fed policymakers' comments, geopolitical tensions, and the June US retail sales report.
Предупреждение о риске
The overall structure is still bullish; any downside move looks like a pullback, not a trend change.
Другие анализы рынка
Изучайте больше профессиональных технических анализов на разных рынках и таймфреймах.
NZDUSD
Купить
Цена входа
0.5845
Сроки
2.00
Опубликовано September 03, 2026
USDJPY
Купить
Цена входа
156.4000
Сроки
1.00
Опубликовано September 03, 2026
EURUSD
Купить
Цена входа
1.1580
Сроки
2.00
Опубликовано September 03, 2026
GBPUSD
Продать
Цена входа
1.3515
Сроки
2.00
Опубликовано September 02, 2026
GBPNZD
Продать
Цена входа
2.3160
Сроки
3.00
Опубликовано September 02, 2026
Gold
Купить
Цена входа
4285.0000
Сроки
3.00
Опубликовано September 02, 2026