シグナルの詳細
取引レベル
テクニカルチャート
市場分析
Key Indicators
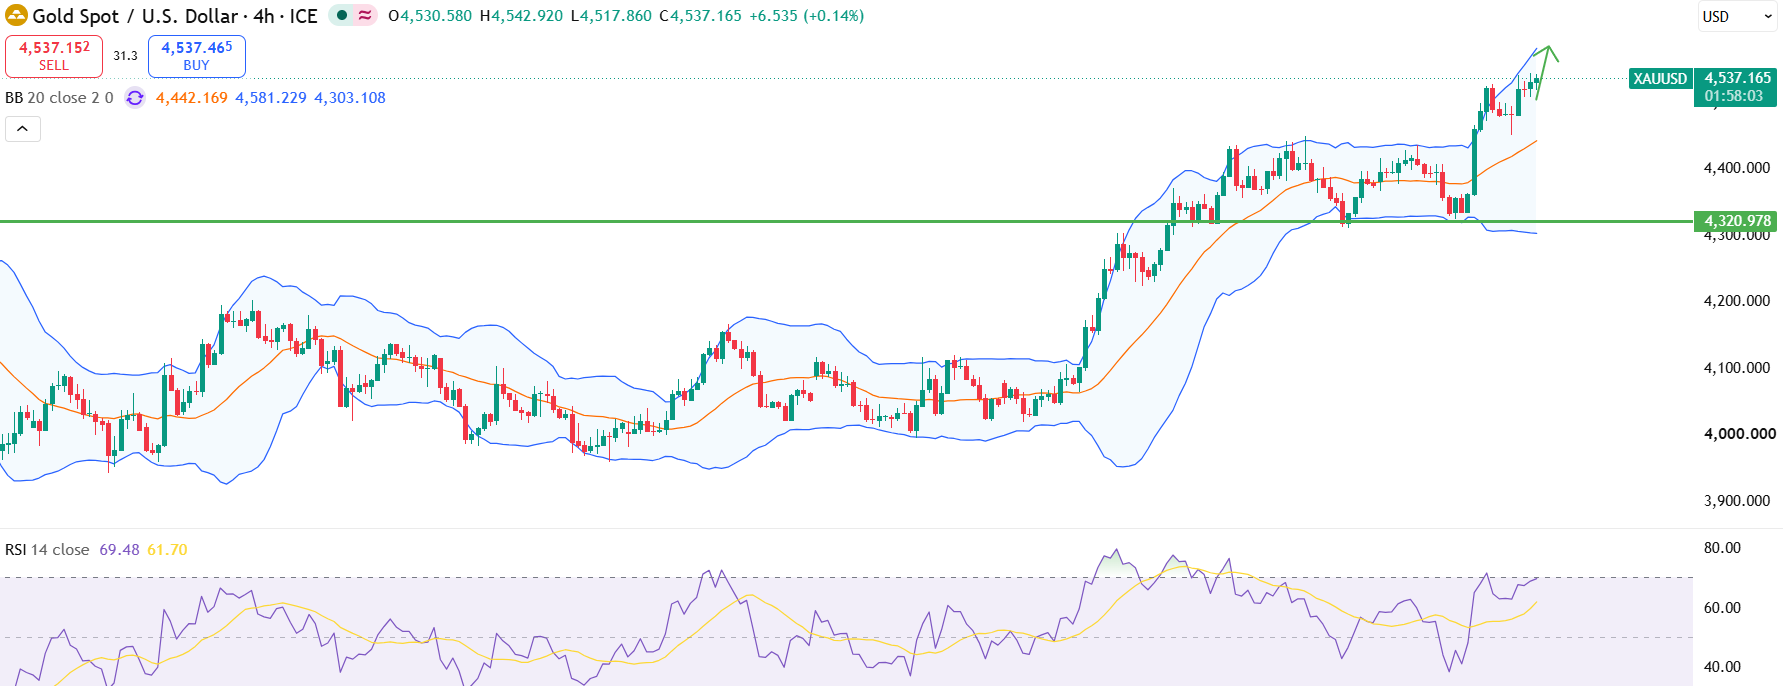
Gold holds above the key $4,500 psychological zone, signaling a short-term bullish shift after weeks of lower highs and lower lows.
Momentum is likely to remain positive while gold trades above the $4,500 pivot level. With buyers currently in control, XAU/USD could advance toward the primary resistance level at $4,600.
Fundamental Context
Gold climbed to a fresh multi-week high of $4,543 on Friday morning, extending its bullish move after breaking above the previous resistance level.
リスク警告

Syam KP
At FX Junction, Syam turns complex market information into clear and useful insights. His work combines technical and fundamental analysis, portfolio management, risk management and timely commentary on global developments. Whether markets are calm or moving fast, Syam focuses on what matters most: understanding the bigger picture, spotting meaningful opportunities and keeping risk firmly in view.