Commodity
2.00
投稿済み September 09, 2026
Gold
購入
BUY
入場料金
4365.0000
シグナルの詳細
方向
購入
入場料金
4365.0000
リスク:リワード
1:1.2
取引レベル
テクニカルチャート
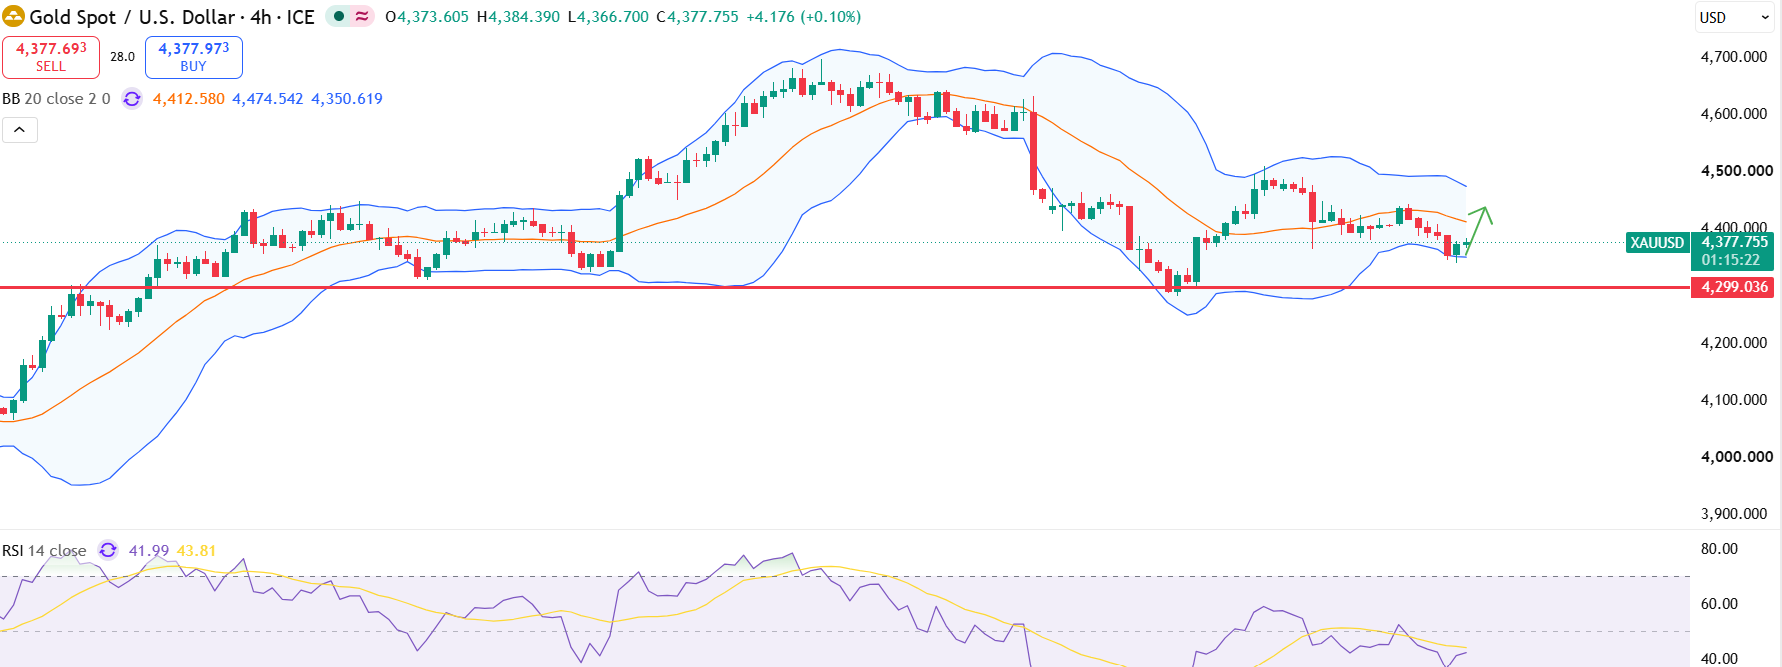
市場分析
The gold price began the week on a mixed note. The metal dropped to a fresh weekly low of $4,442 early in Tuesday's Asian session before recovering some losses.
Key Indicators
Despite the overall momentum remaining mixed, technical indicators on the 1-hour chart suggest the price is in a short-term recovery from the recent decline.
Momentum indicators (MACD positive, RSI climbing at 48.78) hint at recovery.
Fundamental Context
The sustainability of gold’s gains will largely depend on remarks from Federal Reserve policymakers, the performance of the US dollar, the forthcoming US CPI inflation report, and ongoing geopolitical developments.
リスク警告
Despite the short-term rebound, only a sustained break above $4,450 with significant volume will indicate a reversal to a strong bullish trend for this week; otherwise, the overall bias will be mixed.
その他の市場分析
さまざまな市場と時間軸にわたる、より専門的な技術分析をさらに探求しましょう。
GBPUSD
購入
入場料金
1.3535
期間
2.00
投稿済み September 09, 2026
NZDUSD
購入
入場料金
0.5845
期間
2.00
投稿済み September 09, 2026
EURJPY
購入
入場料金
178.6500
期間
2.00
投稿済み September 08, 2026
Dow Jones
販売
入場料金
53050.0000
期間
3.00
投稿済み September 08, 2026
Dollar Index
購入
入場料金
98.7500
期間
3.00
投稿済み September 08, 2026
NZDUSD
購入
入場料金
0.5845
期間
2.00
投稿済み September 03, 2026