Signal Details
Trade Levels
Technical Chart
Market Analysis
Key Indicators
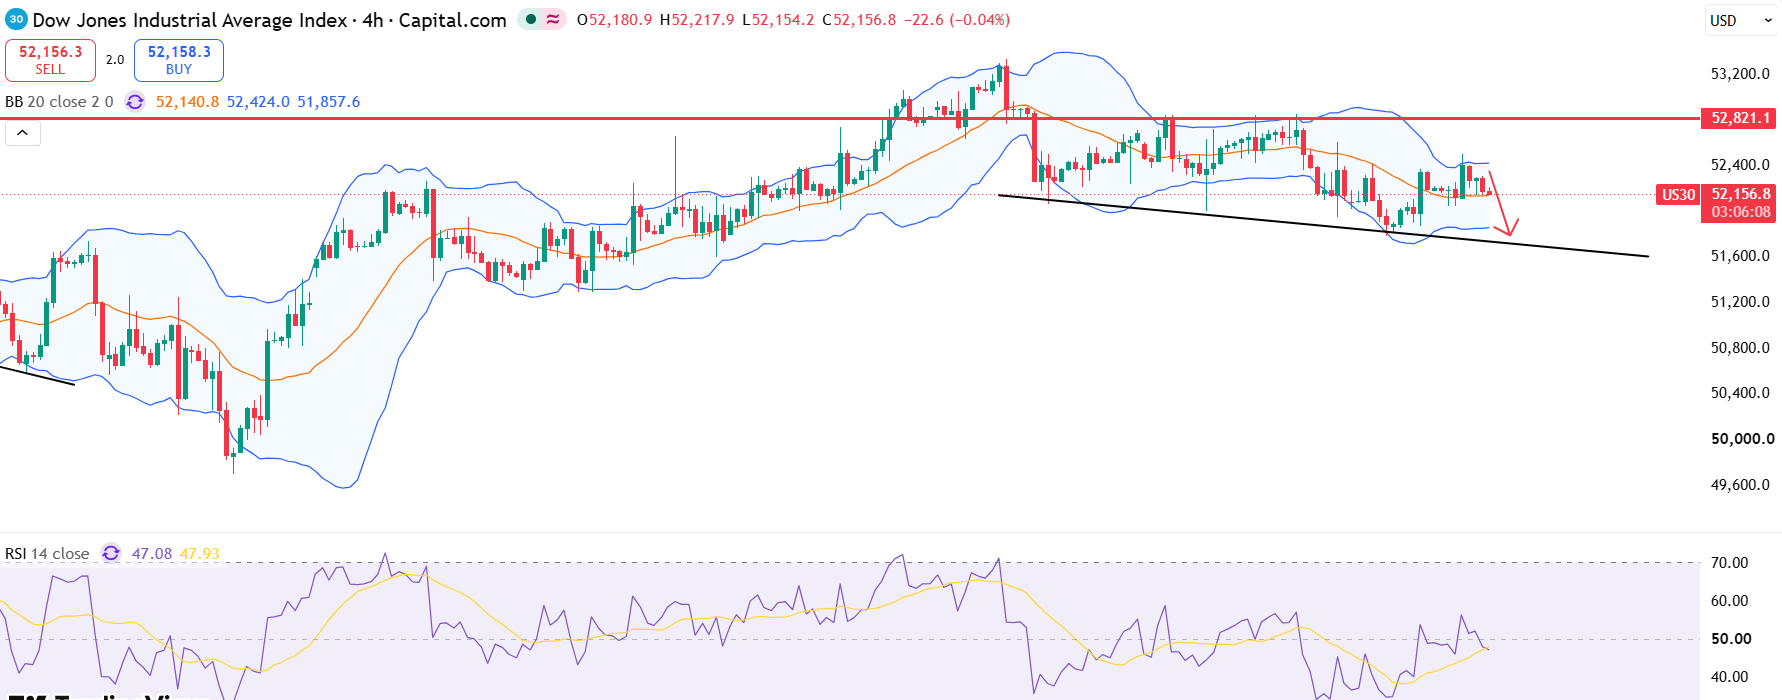
Despite the rebound, the 4-hour chart reveals weak upward momentum, showing signs of exhaustion on lower timeframes.
The price stays below the 20-day SMA, and RSI is struggling to hold above 50, suggesting weak buying momentum.
Fundamental Context
Despite the rebound, the US30 is still struggling to regain strong momentum, as the short-term trend remains neutral to bearish. Therefore, further pullbacks are possible within broader consolidation.
Risk Alert

At FX Junction, Syam turns complex market information into clear and useful insights. His work combines technical and fundamental analysis, portfolio management, risk management and timely commentary on global developments. Whether markets are calm or moving fast, Syam focuses on what matters most: understanding the bigger picture, spotting meaningful opportunities and keeping risk firmly in view.