Forex 4.00
Posted November 17, 2026

GBP/USD

Sell
SELL
Entry Price
1.3220

Signal Details

Direction
Sell
Entry Price
1.3220
Risk: Reward
1:2.28

Trade Levels

Stop Loss
1.3266
Take Profit 1
1.3163
Take Profit 2
1.3115

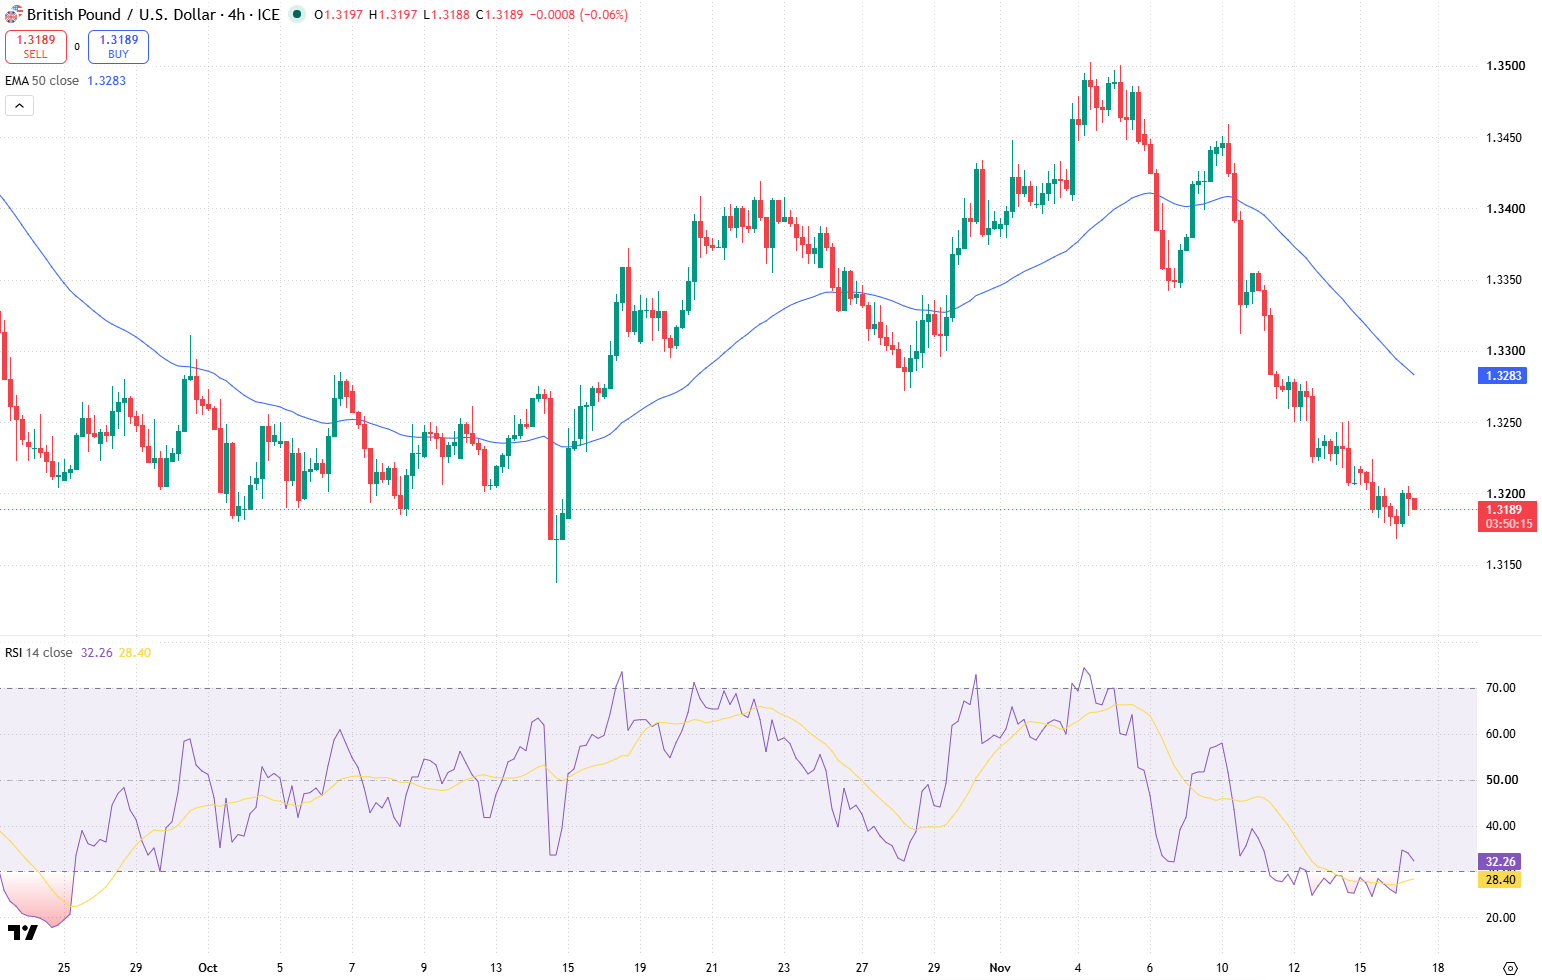
Technical Chart

Market Analysis

GBP/USD remains under pressure after forming a sequence of lower daily highs since November 10. The pair has retreated from 1.3461 towards the 1.3190 area, keeping the broader short-term structure bearish. A corrective recovery into the 1.3217–1.3224 resistance zone could offer a potential short opportunity, provided sellers confirm renewed control.

Key Indicators

  • The 50-period EMA on the 4H timeframe serves as a trend filter, while RSI (14) helps assess momentum.

  • A bearish rejection near resistance, with price remaining below the EMA and RSI weakening beneath 50, would strengthen the case for a continuation lower.

  • These conditions must be confirmed on the selected chart before the entry becomes valid.

Market Outlook

A confirmed short entry near 1.32200 could initially target 1.31630. A sustained move below this support, followed by a break through the intermediate 1.31420 area, would bring the second target at 1.31150 into focus.

The protective Stop Loss is positioned at 1.32660, above the recent swing highs and the higher resistance zone. A sustained recovery through this resistance would weaken the bearish scenario. Without a corrective retest and confirmed rejection, the proposed short remains inactive.

Risk Alert

The proposed short position requires bearish confirmation within the identified resistance zone. A sustained recovery above 1.32510 would weaken the setup, while a move to 1.32660 would reach the planned Stop Loss. Upcoming US retail sales data and UK inflation figures may trigger significant volatility and temporarily disrupt the prevailing technical structure. A decline towards the first target does not guarantee a continuation towards the second.