Crypto 4.00
Posted November 17, 2026

Solana

Sell
SELL
Entry Price
74.7000

Signal Details

Direction
Sell
Entry Price
74.7000
Risk: Reward
1:2.38

Trade Levels

Stop Loss
77.6000
Take Profit 1
70.6000
Take Profit 2
67.8000

Technical Chart

Market Analysis

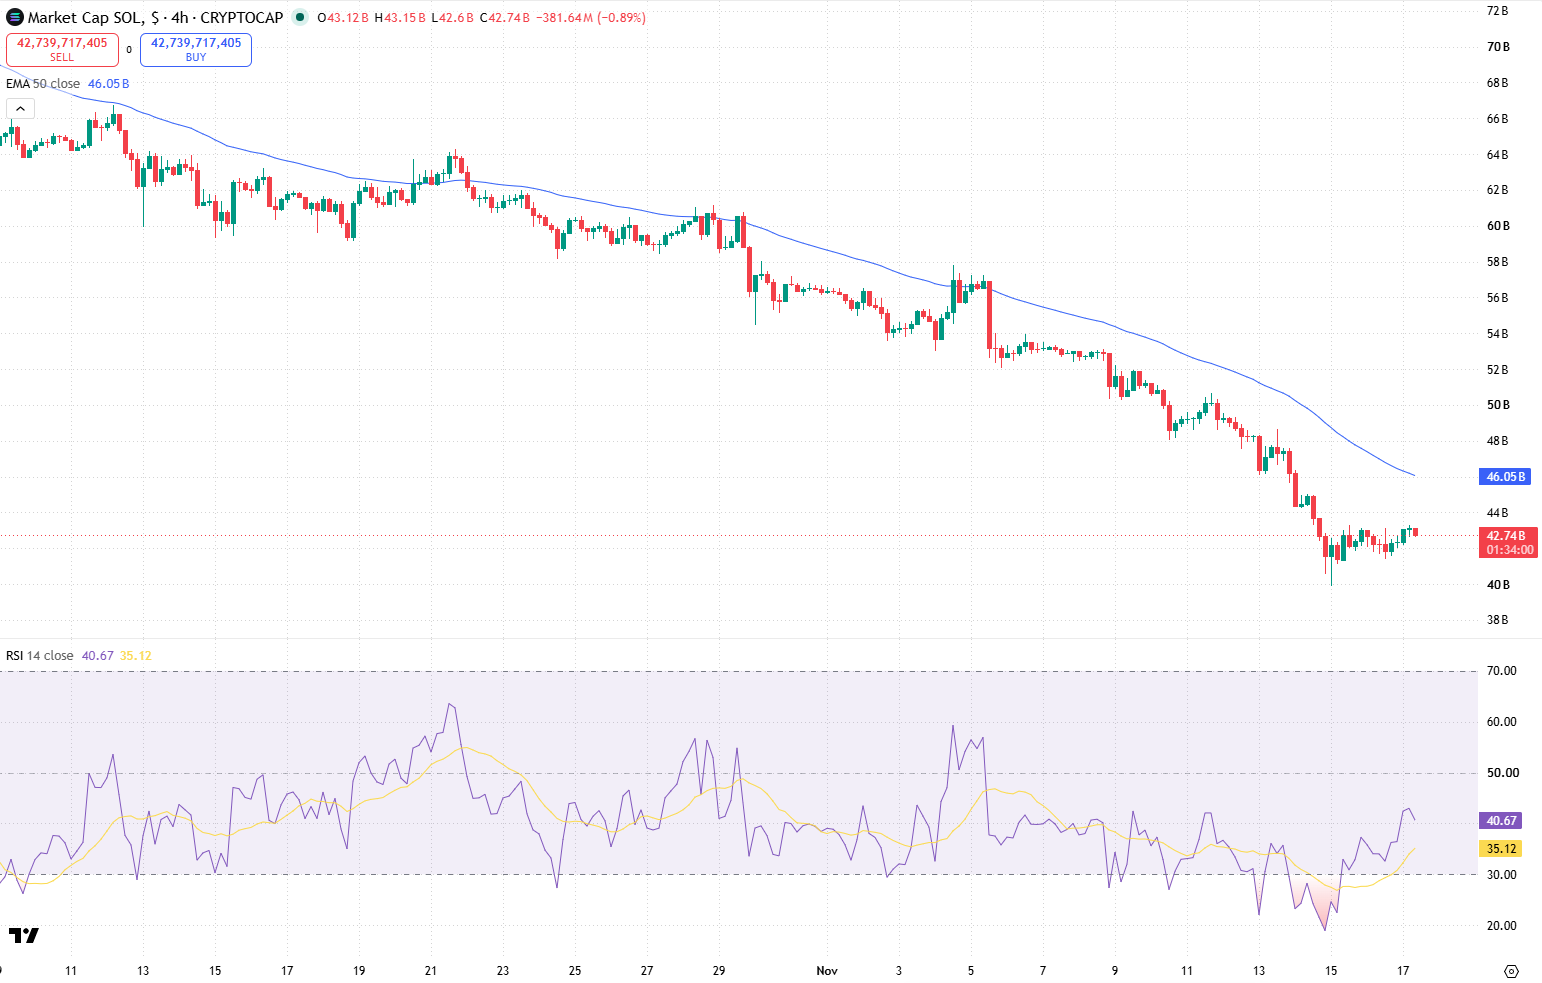
Solana remains in a bearish market structure on both the 4H and daily timeframes. Despite a recent recovery towards 73 USD, the broader decline remains intact. A corrective move into the 74.37–75.09 USD resistance zone could provide an opportunity for sellers to regain control.

This area is particularly relevant because it overlaps with a bearish fair value gap and the 0.5 Fibonacci retracement of the latest 4H decline, located near 74.89 USD.

Key Indicators

  • The 50-period EMA serves as a short-term trend filter, while RSI (14) helps assess momentum.

  • A rejection from resistance, accompanied by weakening RSI momentum below 50, would strengthen the bearish scenario.

Market Outlook

A confirmed short entry near 74.70 USD could initially target the support level at 70.60 USD. A sustained breakdown below this area would open the possibility of a further decline towards 67.80 USD.

The protective Stop Loss is positioned at 77.60 USD, above the higher resistance zone. A strong recovery through resistance would weaken the proposed bearish setup.

Risk Alert

The main technical risk is a sustained recovery above the 74.37–75.09 USD resistance zone. A breakout into the higher resistance area at 76.14–77.17 USD would weaken the bearish setup and increase the risk of reaching the Stop Loss at 77.60 USD. Oversold conditions on the daily timeframe could also trigger a stronger corrective rebound. Additionally, a successful defense of the 70.60 USD support level could interrupt the decline and prevent price from reaching the second target at 67.80 USD.