Forex 4.00
Posted November 17, 2026

USD/CAD

Buy
BUY
Entry Price
1.4235

Signal Details

Direction
Buy
Entry Price
1.4235
Risk: Reward
1:2.60

Trade Levels

Stop Loss
1.4185
Take Profit 1
1.4318
Take Profit 2
1.4365

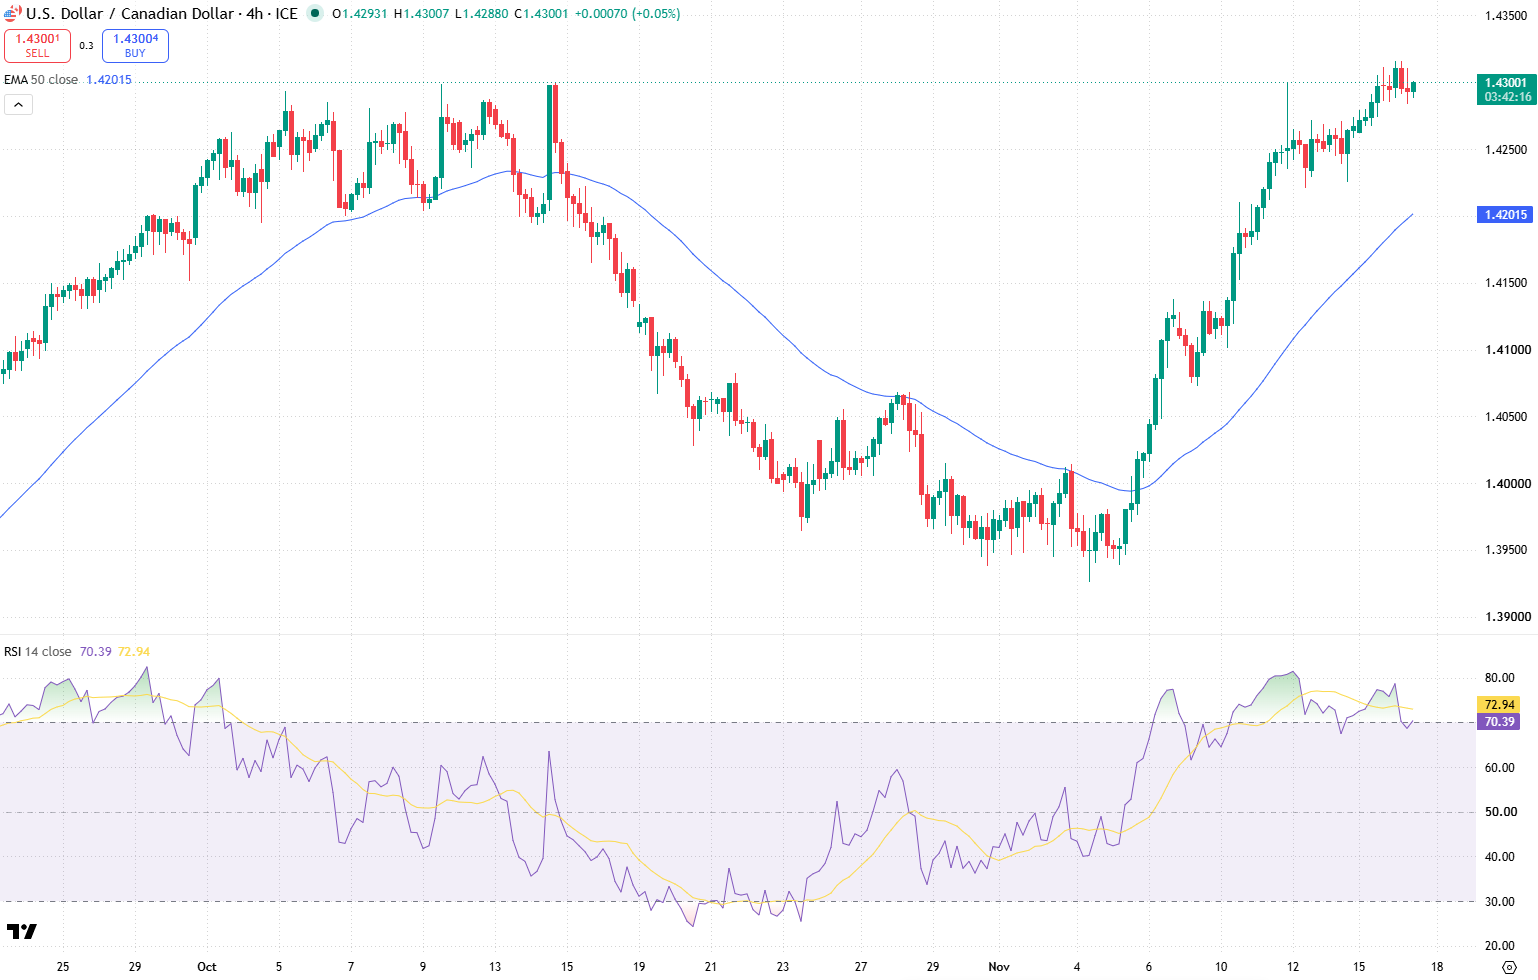
Technical Chart

Market Analysis

USD/CAD maintains a bullish structure after extending its advance towards 1.4300. The US dollar has benefited from Canadian dollar weakness following softer-than-expected inflation data. Canada's annual inflation rate reached 3.1% in October, below the 3.2% forecast, reducing expectations of further monetary tightening by the Bank of Canada.

With the pair approaching recent highs, a corrective pullback towards the 1.4222–1.4240 support zone could offer a more favorable entry than buying at current levels.

Key Indicators

  • The 50-period EMA serves as a short-term trend filter, while RSI (14) helps assess momentum.

  • A bullish reaction within the support zone, supported by improving RSI momentum and price holding above the EMA, would strengthen the case for further upside.

Market Outlook

A confirmed long entry around 1.42350 could target 1.43180 initially, followed by 1.43650 if buying pressure continues. The protective Stop Loss is positioned at 1.41850.

A sustained break below the support zone would weaken the bullish scenario. Meanwhile, the upcoming US retail sales report could influence the dollar's near-term direction and determine whether the current upward momentum can be sustained.

Risk Alert

The main technical risk is a failure of the 1.4222–1.4240 support zone. A temporary bullish reaction without sustained buying momentum could lead to a false recovery, particularly if price forms lower highs or fails to reclaim the 50-period EMA. A confirmed breakdown below 1.4222 would weaken the bullish structure and increase the risk of reaching the Stop Loss at 1.41850. Even if the long setup is confirmed, selling pressure near 1.43180 could prevent further continuation towards the second target at 1.43650.