Forex
1.00
Posted October 13, 2026
USDJPY
Sell
SELL
Entry Price
158.5000
Signal Details
Direction
Sell
Entry Price
158.5000
Risk: Reward
1:3.23
Trade Levels
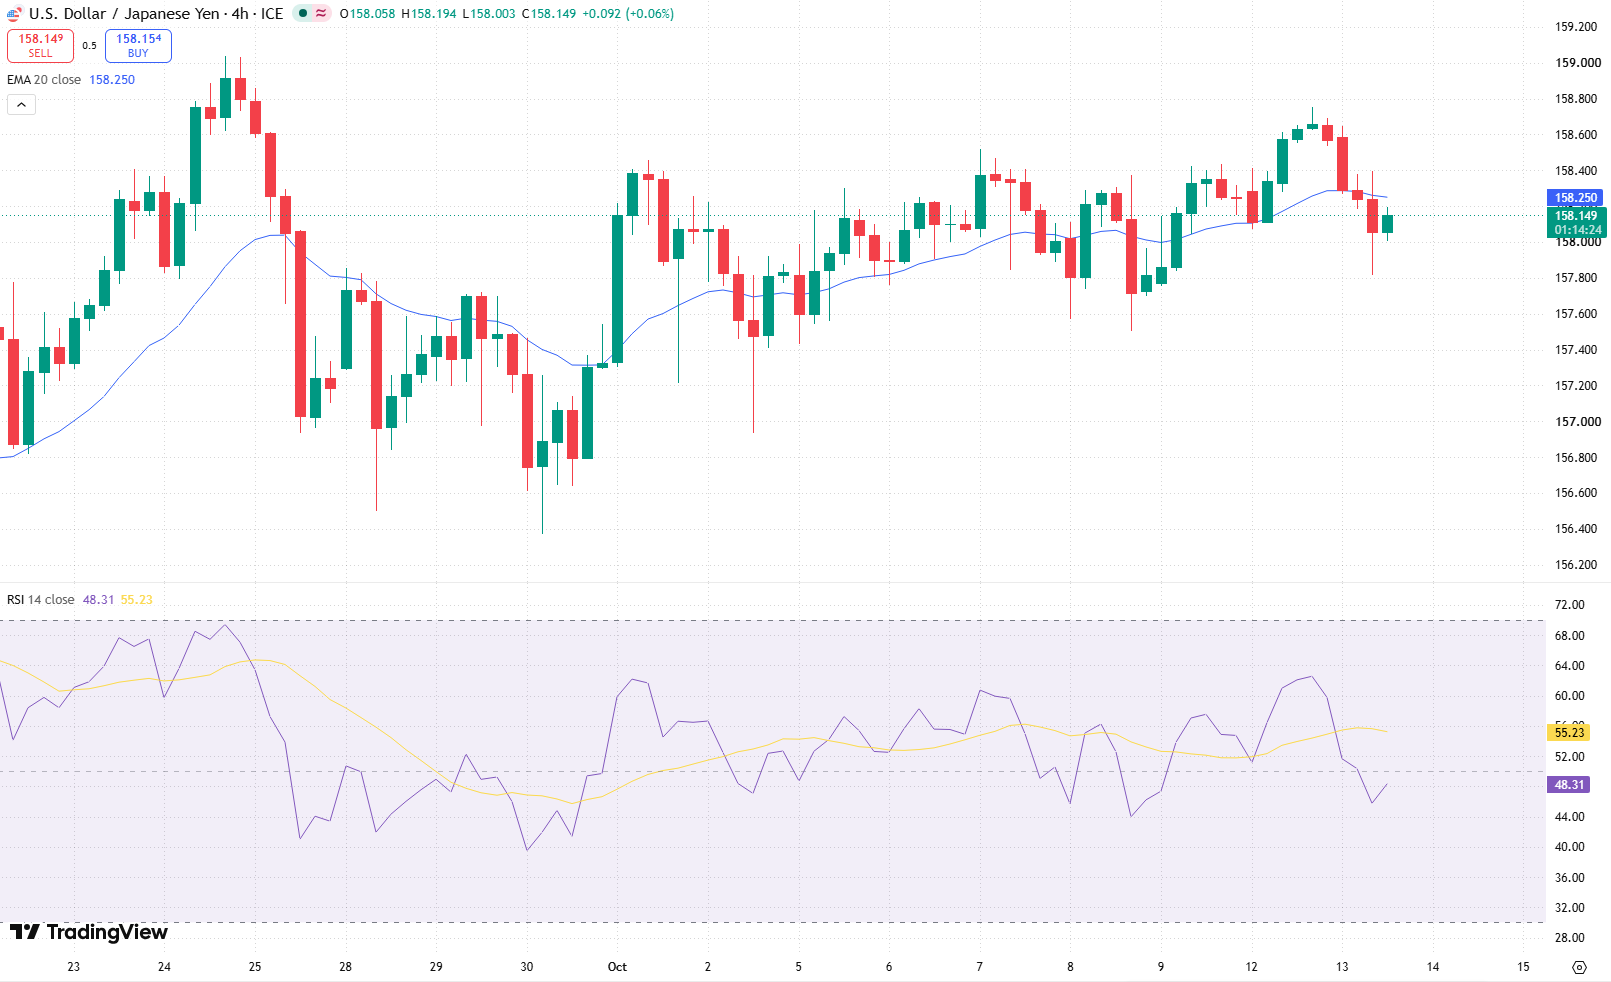
Technical Chart
Market Analysis
USD/JPY remains below its recent highs, with the resistance zone between 158.45 and 158.55 providing a potential area for renewed selling pressure.
Key Indicators
The 20-day EMA serves as a short-term trend reference, while the RSI (14) measures directional momentum. A daily close below the EMA, accompanied by an RSI decline beneath 50, would strengthen the bearish scenario.
Market Outlook
A confirmed rejection around 158.50 could open the way towards 157.50 and subsequently 156.40. The protective Stop Loss is positioned at 159.15. Continued strength above the EMA and RSI readings above 50 would leave the bearish setup without full indicator confirmation.
Risk Alert
The proposed short position requires confirmation near resistance. The entry and target prices are indicative, and market volatility may affect execution. A move above the Stop Loss level would invalidate the trading setup.
Other Market Analyses
Explore more professional technical analyses across different markets and timeframes.
UKOIL
Buy
Entry Price
103.2000
Timeframe
4.00
Posted October 13, 2026
EURUSD
Sell
Entry Price
1.1215
Timeframe
4.00
Posted October 13, 2026
USDJPY
Buy
Entry Price
158.0000
Timeframe
2.00
Posted October 08, 2026
GOLD
Sell
Entry Price
4140.0000
Timeframe
2.00
Posted October 08, 2026
EURGBP
Buy
Entry Price
0.8465
Timeframe
2.00
Posted October 08, 2026
USDCAD
Sell
Entry Price
1.4240
Timeframe
3.00
Posted October 07, 2026