Forex 4.00
Posted November 18, 2026

USD/JPY

Buy
BUY
Entry Price
158.9800

Signal Details

Direction
Buy
Entry Price
158.9800
Risk: Reward
1:2.08

Trade Levels

Stop Loss
158.4500
Take Profit 1
159.6500
Take Profit 2
160.0800

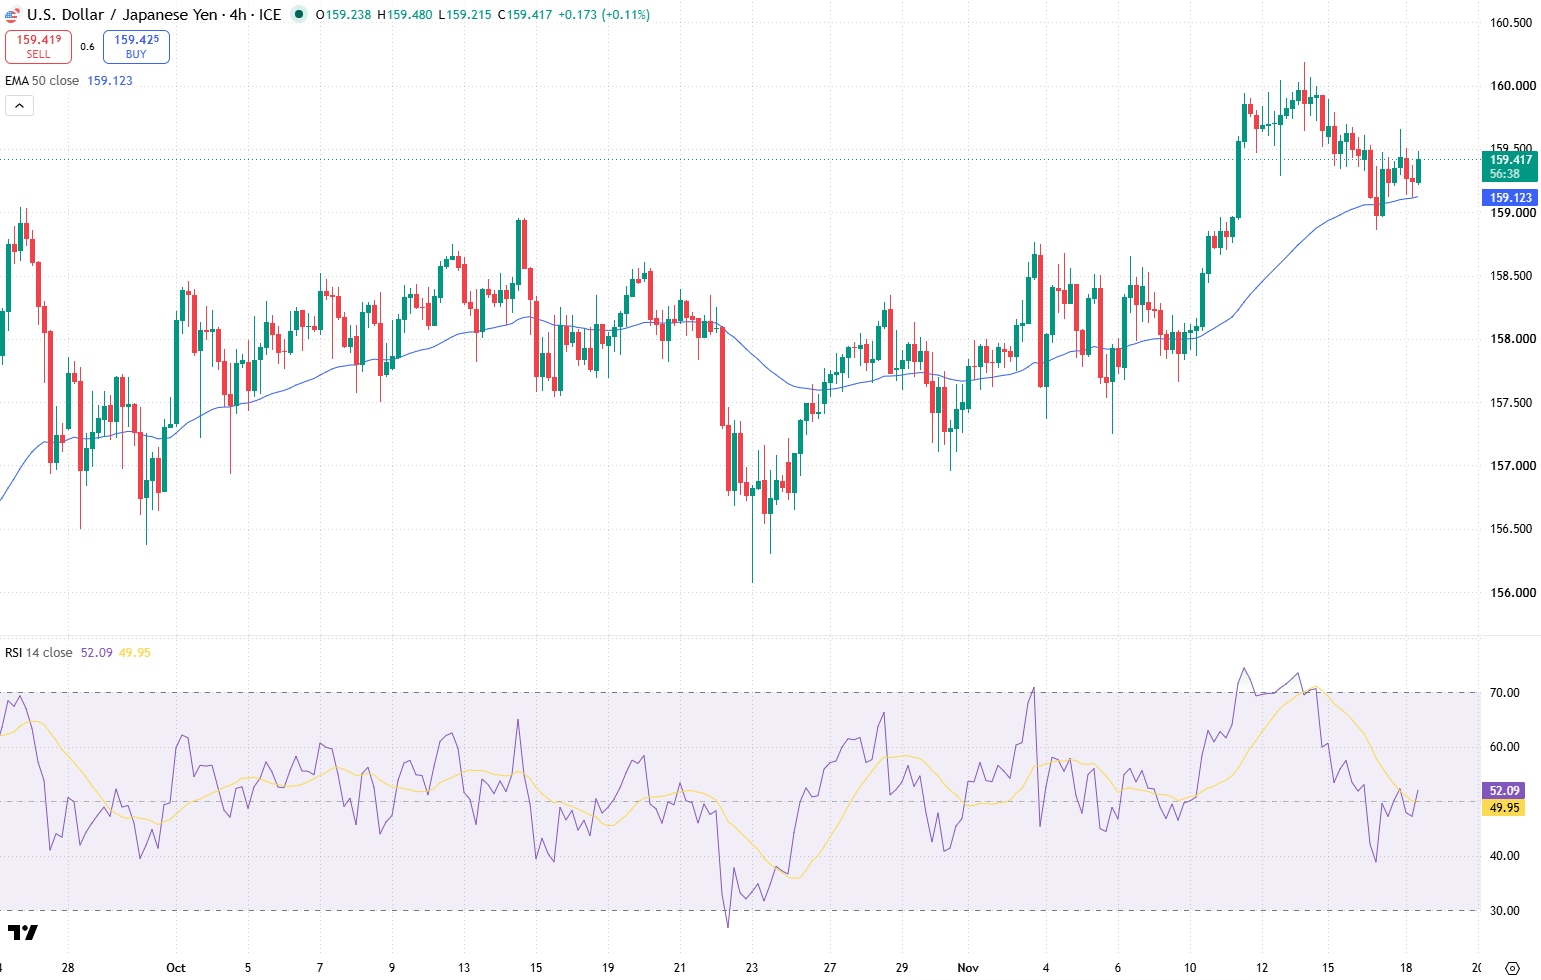
Technical Chart

Market Analysis

USD/JPY remains within a broader bullish trend despite the recent correction from the November 13 high near 160.20. The decline towards 158.87 was followed by renewed buying interest, suggesting that the latest pullback may represent a temporary correction rather than a confirmed trend reversal.

The 158.95–159.10 support zone represents a potential area for long positioning if price returns to this region and confirms renewed bullish momentum.

Key Indicators

  • The 50-period EMA serves as a short-term trend filter, while RSI (14) helps assess momentum.

  • A bullish rejection from support, accompanied by strengthening RSI and a subsequent recovery above the EMA, would reinforce the bullish scenario.

Market Outlook

A confirmed long entry around 158.980 could initially target 159.650, where the market recently encountered resistance. A sustained breakout above this level could support further appreciation towards 160.080.

The protective Stop Loss is positioned at 158.450, below the secondary support around 158.530. A sustained decline through the identified support areas would weaken the bullish setup and increase the probability of a deeper correction.

Risk Alert

The main technical risk is a failure to defend the 158.95–159.10 support zone. A sustained breakdown below 158.87 would weaken the bullish recovery and expose the secondary support around 158.53, increasing the probability of reaching the Stop Loss at 158.450. Additionally, resistance near 159.650 could trigger another rejection and prevent further upside. Even if this level is breached, renewed selling pressure around the psychological 160.00 level could interrupt the advance before the second target at 160.080 is reached.